

If Beauty's On The Inside, This Market Wins The Ugly Contest
Courtesy of Dana Lyons, Tumblr

We talk often about the importance we place on solid internals when gauging the health of the stock market. The more stocks that are advancing versus declining, the stronger the foundation – and the more adversity the market is able to withstand. This is especially valid on a longer-term, cumulative basis. However, short-term readings can signal a red flag in the near-term as well. For example, we have taken note of several days over the past 12 months that, on the surface via the major averages, appeared to be strong. However, looking deeper at the internals of such days (including July 18, 2014, November 13, 2014, April 24, 2015 and May 1, 2015), we see that the broader market of stocks was actually relatively weak.
Such days are not always an ominous signal of substantial weakness, and indeed the aforementioned dates were not precursors to any major market damage. However, the market did struggle to make any gains over the subsequent 2-3 months each time, despite the generally positive environment during the period.
Friday brought another superficially strong day that, under the hood, exhibited weak internals on par with the dates mentioned above. While the S&P 500 closed higher and the Nasdaq 100 closed up nearly 1.5% to a 52-week high, the market internals were pretty darn ugly from a historical perspective. Here are a few examples of what we mean:
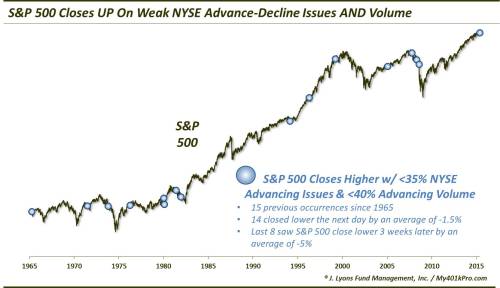
1.) S&P 500 closed UP but there were far more NYSE Declining Issues than Advancing Issues.
Generally, we see breadth (i.e., advancers versus decliners) move in the same direction as the S&P 500. At least they don’t tend to move to opposite ends of the spectrum. However, on Friday, despite the S&P 500 closing positive, less than 35% of NYSE issues closed higher on the day (1075 vs. 2000). To put that into perspective, since 1965, there have been just 31 other days that saw the S&P 500 close up with NYSE breadth that poor. In other words, of the 6,657 days since 1965 when the S&P 500 closed up, Friday had the 6,627th worst breadth.
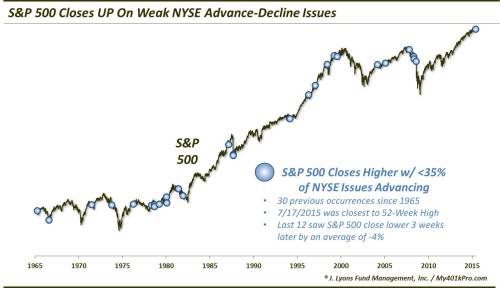
Returns following the other days were generally weak in the near to intermediate-term.
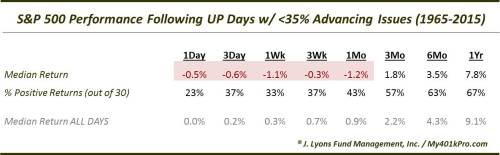
Of note, the last 12 times this situation occurred, the S&P 500 was lower 3 weeks later each time by an average of -4%. Also of note, for what it is worth, this is the closest to a 52-week high the S&P 500 has ever been on any of the occurrences.
2.) S&P 500 closed UP but there was far more NYSE Declining Volume than Advancing Volume.
Similar to above, the volume in advancing issues on the NYSE versus declining issues did not have the hallmarks of an S&P 500 UP day on Friday. This one is even a bit more surprising. Obviously, when the large-cap S&P 500 index closes up on weak breadth, it means that relatively few large cap stocks likely closed higher, dominating the daily calculation of the cap-weighted S&P 500. Thus, it is even rarer to see volume skew in the opposite direction of the index. Yet, we saw that on Friday as advancing volume accounted for just 28% of all NYSE volume. How odd is that? Of the 6,657 UP days in the S&P 500, that is the 6th worst declining volume skew ever. In fact, there have been just 40 days ever now with advancing volume accounting for less than 40% of all NYSE volume.
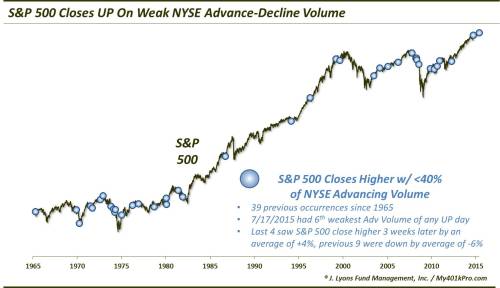
Returns following such occurrences were similar to those following the weak advancing-declining issues.
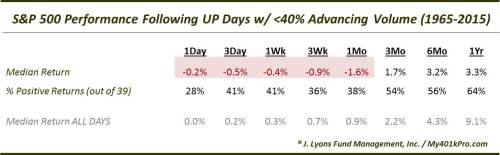
Of note, the last 4 times this situation occurred, the S&P 500 was higher 3 weeks later each time by an average of +4%. The previous 9 all closed down by an average of -6%.
3.) S&P 500 closed UP on far more NYSE Declining Issues AND Volume.
This is a combination of the two studies above, thus, the results are pretty much as expected. However, it does serve to show just how unusual an “UP” day it was on Friday. There have been only 15 days since 1965 that saw the S&P 500 close higher with both NYSE advancing issues at <35% of total issues AND advancing volume at <40% of total volume.
Median returns were similar to the prior studies, not surprisingly.
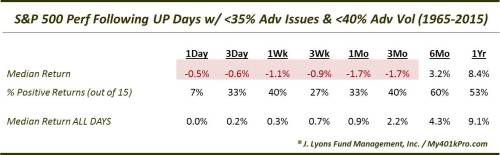
However, the consistency of the returns was a little more evident. Consider, the following day, the S&P 500 closed lower on 14 of 15 occasions. Also, the last 8 occurrences saw the S&P 500 close lower 3 weeks later by an average of -5%.
4.) Nasdaq 100 closed up >1% to a 52-Week High on more Nasdaq Declining Issues AND Volume.
Switching exchanges to the Nasdaq, we see a similar story though in a way, even more exaggerated. The Nasdaq 100 was the star of the day on Friday, closing up nearly 1.5% to a 52-Week High (thanks in large part to Google). Despite that impressive showing, however, breadth on the Nasdaq exchange was negative in both the issues and, amazingly, the volume. Since 1991, this was just the 28th time the NDX performed such a feat with more declining issues than advancing issues. And it was just the 3rd time ever that it did so with more declining volume as well (the other 2 dates were December 27, 1999 and April 24, 2015). And FYI, Friday’s breadth AND volume were the worst of any of the occurrences in this sample.
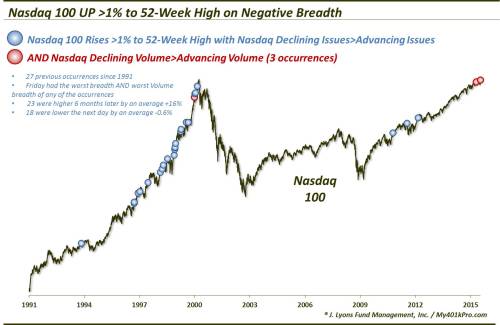
As the chart shows, most of the occurrences, unsurprisingly, took place during the late-1990′s. This was a period marked by a massive rally in the Nasdaq 100 stocks while the majority of stocks declined. Due to the timing of those occurrences, the historical track record following these circumstances is not at all dire looking.
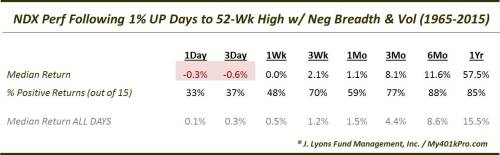
After some struggles in the short-term, the intermediate to long-term results are stellar. Again, this is a function of when these occurrences took place. The 5 events that did not occur in the late-1990′s mostly saw the NDX struggle over the following 3-6 months. so we would caution folks against relying too much on the late-1990′s as a template. There is a reason we call that period the “great divergence” as most stocks actually declined while the Nasdaq was blasting to the moon. It was an unprecedented period that provides a risky comparison despite some similarities to today’s market.
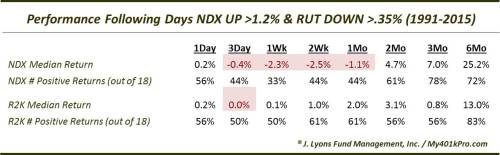
5.) Nasdaq 100 closed up more than 1.2% while the Russell 2000 closed down over 0.35%.
While the Nasdaq 100 mega-cap index was soaring on Friday, the small cap Russell 2000 was actually losing ground. It has been especially unusual for the RUT to be down as much as it was on a day the NDX closed so strongly. Specifically, there have been only 18 prior occurrences since 1991 that the Russell 2000 closed down more than -0.35% while the NDX gained at least +1.20%. Also of interest, Friday marked just the 2nd time that occurred while the NDX hit a 52-week high (January 3, 2000 was the other date).
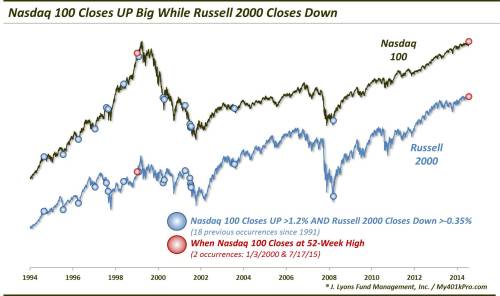
The NDX has had a tendency to struggle in the near-term following these events, moreso than the Russell 2000. However, many of the instances occurred after a significant decline had already occurred. Therefore, the negative action was fairly contained after that. We will say that those events occurring with the NDX closer to its 52-week high had a tendency to underperform.
Breadth, or the internals of a market, is an important indicator in determining how healthy a market is in a broad sense. The more stocks advancing than declining, the better. When we get a situation where the main averages continue to advance, and even make new highs, while the majority of stocks are stagnant or declining, it is an indication of vulnerability. It does not necessarily mean the immediate end of the road for a bull market. However, with fewer stocks participating, the market is less able to withstand adversity. A deterioration in breadth is especially pertinent on a longer-term basis as it can be a harbinger of an intermediate-term or even cyclical market top. There are an ever-increasing number of such signs, in our view.
On a shorter-term scale, this deterioration can give a head’s up of potential exhaustion in a rally. When the majority of stocks stop participating in an advance, the market becomes vulnerable to a reversal, or at least a pause. We have seen that on a few specific days over the past 12 months as the averages did well while the majority of stocks failed to keep up. And we saw it in spades on Friday. While the main indices hit or threatened new highs, the market internals were historically poor, relatively speaking. This may be a red flag for the broader market in the near-term.
In summary, there is nothing wrong with a large-cap index hitting a 52-week high. In fact, it’s a beautiful thing, especially for relative strength-based systems that have one concentrated in such areas. However, don’t automatically think all is well for stocks in general based on a narrow, superficial view of the market. Because if beauty is on the inside as they say, a view of the internals suggests this market could win an ugly contest.
_____________
More from Dana Lyons, JLFMI and My401kPro.
The commentary included in this blog is provided for informational purposes only. It does not constitute a recommendation to invest in any specific investment product or service. Proper due diligence should be performed before investing in any investment vehicle. There is a risk of loss involved in all investments.