

Reminder: Sabrient is available to chat with Members, comments are found below each post.
Courtesy of Sabrient Systems and Gradient Analytics
This year, the S&P 500 has greatly underperformed its average 18% return that it historically provides during the third year of a Presidential election cycle. But then, a lot seems to be different this year as correlations across most asset classes are high and prices are buffeted more by news events than fundamentals (which has made stock picking quite challenging).
Dovish policies by central banks around the globe have become the main drivers for improving bullish conviction, and now with a strong technical picture bolstered by solid earnings reports from market bellwethers, positive seasonality, and improving market internals, the near-term path of least resistance appears to be to the upside.
In this weekly update, I give my view of the current market environment, offer a technical analysis of the S&P 500 chart, review our weekly fundamentals-based SectorCast rankings of the ten U.S. business sectors, and then offer up some actionable trading ideas, including a sector rotation strategy using ETFs and an enhanced version using top-ranked stocks from the top-ranked sectors.
Market overview:
On Thursday-Friday last week, the major averages were quite strong, with the Dow Industrials surging 578 points. On Friday, Technology and Healthcare were the clear winners. The biotech segment in particular tried to do some catching up for recent underperformance (and many Sabrient favorites in the space are selling at highly compelling valuations). Both sectors gapped up strongly, as did the NASDAQ 100 Index, which is largely made of stocks from these two sectors. Solid earnings reports from bellwethers like Amazon.com (AMZN), Alphabet (GOOGL), and Microsoft (MSFT) inspired the bulls to an extent, but the real driver on Thursday-Friday was the central banks in Europe and China.
ECB President Mario Draghi offered up renewed dovish sentiment by leaving interest rates unchanged, suggesting that both growth and inflation were facing downside risks, and indicating that December will be a time to re-examine current policies. Investors interpreted this to mean that the ECB will likely implement more QE in December. In addition, China’s central bank cut the cost of borrowing by 25 bps.
Despite high levels of existing debt around the globe, central banks are now encouraging higher indebtedness as a path to growth — in the hope that prosperity ultimately may lead to debts being paid down — rather than austerity, which has worked for some countries (notably Ireland) but not so much for others (notably Greece) and tends to be widely reviled.
Many economists believe that China cannot remain competitive if it does not significantly devalue the renminbi — especially when you consider that the Japanese yen has fallen 35% against the renminbi over the past three years – but the only viable approach to doing so is a slow and gradual currency depreciation that spurs economic growth in China and emerging markets.
Lately, investors here in the U.S. are facing a Twilight Zone of sorts in which everything revolves around the magic 2%. To wit, the 10-year Treasury yield is languishing at 2.06%, while the S&P 500 dividend yield is 2.15% (historically, stocks tend to remain strong once their dividend yield surpasses the 10-year yield); the Fed's inflation target is 2%, and GDP growth has been in the same general 2% range. Not sure what to make of this.
The San Francisco Fed Reserve has apparently explored the concept of a natural rate of interest, and their best estimate is approximately -2.1% (yes, negative), which means the Fed’s current ZIRP strategy still may be too high for current economic conditions. Fed funds futures (which tend to be quite prescient) are forecasting only a 37% chance of a quarter-point rate hike in December and a 43% chance in January.
My view has been that the Fed Reserve is becoming less and less likely each day to boost the fed funds rate in this environment, as the adverse risks of tightening outweigh the positives. Moreover, I think the numerous global headwinds are already priced into U.S. equities, and with positive seasonal factors starting to kick in, there should be near-term upside for stocks.
Further bolstering this view are the following: personal consumption expenditures are strong, housing is solid, jobless claims are low, GDP growth is improving, corporate earnings are strong if you exclude the Energy sector, and bond rates remain low, which supports higher equity multiples as investors desperately seek liquid assets with higher returns.
The CBOE Market Volatility Index (VIX), a.k.a. fear gauge, closed Monday at 15.29, after dipping below the important 15 threshold on Friday (intraday as low as 13.36). S&P Indices reports that every one of its volatility metrics is down. The largest declines occurred in hot spots like China (based on Hong Kong and Australia equity markets), continental Europe, and crude oil, and more than half of S&P’s volatility metrics are below their 200-day SMAs. On the other hand, credit spreads in U.S. high yield bonds have been creeping up for over two years.
Apple (AAPL) reports afterhours on Tuesday, which could be market-moving.
SPY chart review:
The SPDR S&P 500 Trust (SPY) closed Monday at 207, which is back above both its 50-day and 200-day simple moving averages, leading many technicians to say that the bottom is in for this year. Indeed, the chart indicates that a W-bottom has formed, which is considered to be a strong technical pattern that confirms the market endured only a healthy correction and not the start of a bear market — which only can be reversed by a Black Swan event. On the other hand, large caps have greatly outperformed mid-caps and especially small caps, and the cap-weighted indexes have outperformed the equal weighted. So, although equities are rallying, the riskier end of the spectrum is lagging and breadth remains narrow. Oscillators RSI, MACD, and Slow Stochastic are getting a bit extended, so some consolidation at this level might be in order. The 211 price (August highs) is the next level of minor resistance, followed by the summer highs near 214. Support resides at 204 (former support line for the long sideways consolidation from February through late-August), followed by the round-number 200 level (corresponding to 2,000 on the S&P 500), and then the gap up from 195. I have been saying that the chart is shaping up a lot like 1998 and 2011, and bulls will likely find a way to take stocks higher by year end — possibly to new highs.
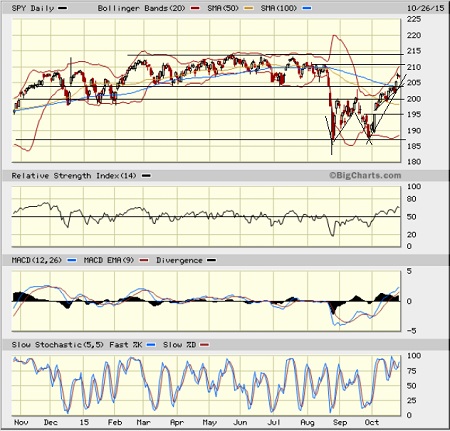
Beyond this bullish technical picture, market internals supported the breakout last week by showing more new highs than new lows on the NYSE for the first time since May, while the percentage of stocks above their 50-day SMA exceeds 60% (compared with only 5% on August 25 and 10% on September 28).
Latest sector rankings:
Relative sector rankings are based on our proprietary SectorCast model, which builds a composite profile of each equity ETF based on bottom-up aggregate scoring of the constituent stocks. The Outlook Score employs a forward-looking, fundamentals-based multifactor algorithm considering forward valuation, historical and projected earnings growth, the dynamics of Wall Street analysts’ consensus earnings estimates and recent revisions (up or down), quality and sustainability of reported earnings (forensic accounting), and various return ratios. It helps us predict relative performance over the next 1-3 months.
In addition, SectorCast computes a Bull Score and Bear Score for each ETF based on recent price behavior of the constituent stocks on particularly strong and weak market days. High Bull score indicates that stocks within the ETF recently have tended toward relative outperformance when the market is strong, while a high Bear score indicates that stocks within the ETF have tended to hold up relatively well (i.e., safe havens) when the market is weak.
Outlook score is forward-looking while Bull and Bear are backward-looking. As a group, these three scores can be helpful for positioning a portfolio for a given set of anticipated market conditions. Of course, each ETF holds a unique portfolio of stocks and position weights, so the sectors represented will score differently depending upon which set of ETFs is used. We use the iShares that represent the ten major U.S. business sectors: Financial (IYF), Technology (IYW), Industrial (IYJ), Healthcare (IYH), Consumer Goods (IYK), Consumer Services (IYC), Energy (IYE), Basic Materials (IYM), Telecommunications (IYZ), and Utilities (IDU). Whereas the Select Sector SPDRs only contain stocks from the S&P 500, I prefer the iShares for their larger universe and broader diversity. Fidelity also offers a group of sector ETFs with an even larger number of constituents in each.
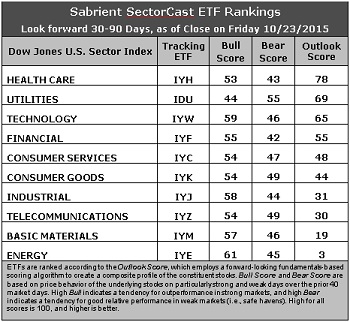
Here are some of my observations on this week’s scores:
1. Healthcare remains in the top spot this week with an Outlook score of 78. It displays a relatively solid forward long-term growth rate and return ratios, and relatively good sentiment among Wall Street analysts (net revisions to earnings estimates). Even though the overall trend continues to be skewed toward reductions to forward estimates, a lack of cuts, even without a strong upside bias, earns a sector a good relative score. Largely because of this, Utilities remains in second ahead of Technology with a score of 69 on the strength of the second most positive sentiment among Wall Street analysts (relatively speaking, next to Telecom), as well as a reasonable forward P/E. Technology, Financial, and Consumer Services (Discretionary/Cyclical) round out the top five. Financial continues to display the lowest forward P/E (about 14.7x), while Technology has the highest forward long-term growth rate and Consumer Services the best insider sentiment.
2. Energy remains at the bottom with an Outlook score of 3 as the sector scores among the worst in all factors of the GARP model across the board. In particular, the sector still shows an increasingly negative forward long-term growth rate and low return ratios, as well as the highest forward P/E (now over 26x, as share prices continue to rise). (However, note that the refining & marketing segment remains an area of strength within the sector.) Basic Materials takes the other spot in the bottom two with an Outlook score of 19.
3. Looking at the Bull scores, Energy tops the list with a 61, followed by Technology and Industrial, while Utilities is the lowest at 44. The top-bottom spread 17 points, which reflects fairly low sector correlations on particularly strong market days, which is good. It is generally desirable in a healthy market to see low correlations reflected in a top-bottom spread of at least 20 points, which indicates that investors have clear preferences in the stocks they want to hold (rather than broad risk-on behavior).
4. Looking at the Bear scores, Utilities displays the top score of 55, which means that stocks within this sector have been the preferred safe havens (relatively speaking) on weak market days. Financial scores the lowest at 42, as investors flee this sector during market weakness. The top-bottom spread is only 13 points, which reflects somewhat elevated sector correlations on weak market days. Ideally, certain sectors will hold up relatively well while others are selling off (rather than broad risk-off behavior), so it is generally desirable in a healthy market to see low correlations reflected in a top-bottom spread of at least 20 points.
5. Healthcare displays the best all-around combination of Outlook/Bull/Bear scores, while Energy is the worst. However, looking at just the Bull/Bear combination, these sectors flip flop — Energy is the best, indicating superior relative performance (on average) in extreme market conditions (whether bullish or bearish), followed by Technology, while Healthcare is the worst.
6. Although I continue to categorize this week’s fundamentals-based Outlook rankings as neutral, they are starting to take a somewhat bullish tilt, with economically-sensitive sectors Technology, Financial, and Consumer Services (Discretionary/Cyclical) in the top five along with all-weather Healthcare, while Consumer Goods (Staples/Noncyclical) has fallen from the top five. However, defensive sector Utilities continuing to rank near the top gives me pause — as does the constant flow of negative earnings revisions from Wall Street analysts. Keep in mind, the Outlook Rank does not include timing, momentum, or relative strength factors, but rather is a reflection of the fundamental expectations of individual stocks aggregated by sector.
Stock and ETF Ideas:
Our Sector Rotation model, which appropriately weights Outlook, Bull, and Bear scores in accordance with the overall market’s prevailing trend (bullish, neutral, or defensive), has moved to a bullish bias and suggests holding Technology, Healthcare, and Industrial, in that order. (Note: In this model, we consider the bias to be bullish from a rules-based trend-following standpoint when SPY is above both its 50-day and 200-day simple moving averages.)
Other highly-ranked ETFs in SectorCast from the Technology, Healthcare, and Industrial sectors include iShares North American Tech-Multimedia Networking ETF (IGN), ETFis BioShares Biotechnology Products Fund (BBP), and US Global Jets ETF (JETS).
For an enhanced sector portfolio that enlists some top-ranked stocks (instead of ETFs) from within the top-ranked sectors, some long ideas from Technology, Healthcare, and Industrial sectors include Cisco Systems (CSCO), Facebook (FB), Gilead Sciences (GILD), Exelixis (EXEL), Delta Air Lines (DAL), and Ryanair (RYAAY). All are highly ranked in the Sabrient Ratings Algorithm and also score among the top two quintiles (lowest accounting-related risk) of our Earnings Quality Rank (a.k.a., EQR), a pure accounting-based risk assessment signal based on the forensic accounting expertise of Sabrient subsidiary Gradient Analytics.
If you prefer to take a neutral bias, the Sector Rotation model suggests holding Healthcare, Utilities, and Technology, in that order. But if you prefer a defensive stance on the market, the model suggests holding Utilities, Consumer Goods (Staples/Noncyclical), and Technology, in that order.
IMPORTANT NOTE: I post this information each week as a free look inside some of our institutional research and as a source of some trading ideas for your own further investigation. It is not intended to be traded directly as a rules-based strategy in a real money portfolio. I am simply showing what a sector rotation model might suggest if a given portfolio was due for a rebalance, and I may or may not update the information each week. There are many ways for a client to trade such a strategy, including monthly or quarterly rebalancing, perhaps with interim adjustments to the bullish/neutral/defensive bias when warranted — but not necessarily on the days that I happen to post this weekly article. The enhanced strategy seeks higher returns by employing individual stocks (or stock options) that are also highly ranked, but this introduces greater risks and volatility. I do not track performance of the ETF and stock ideas mentioned here as a managed portfolio.
Disclosure: Author has no positions in stocks or ETFs mentioned.
Disclaimer: This newsletter is published solely for informational purposes and is not to be construed as advice or a recommendation to specific individuals. Individuals should take into account their personal financial circumstances in acting on any rankings or stock selections provided by Sabrient. Sabrient makes no representations that the techniques used in its rankings or selections will result in or guarantee profits in trading. Trading involves risk, including possible loss of principal and other losses, and past performance is no indication of future results.
Picture via Pixabay.