

Courtesy of Mish.
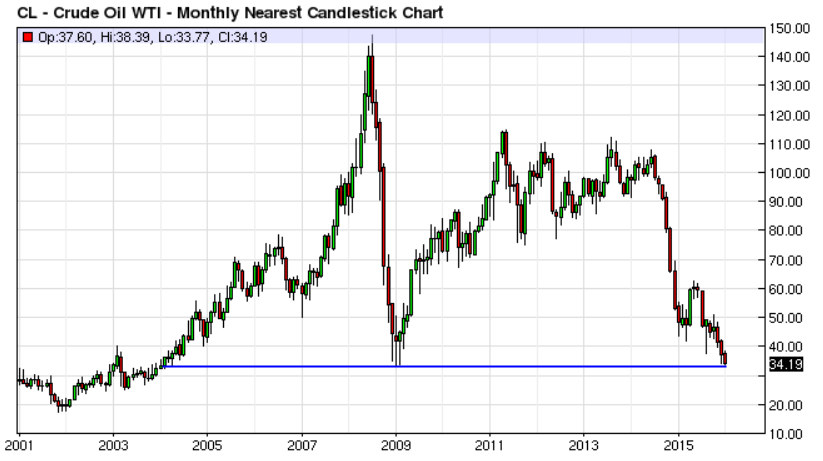
Oil swooned again yesterday, from $35.97 to $34.15. It’s down again today.
Were the month to close here (charts below captured yesterday), this would be the lowest monthly close dating all the way back to December 2003.
Crude Monthly Chart
click on any chart for sharper image
Crude Daily Chart
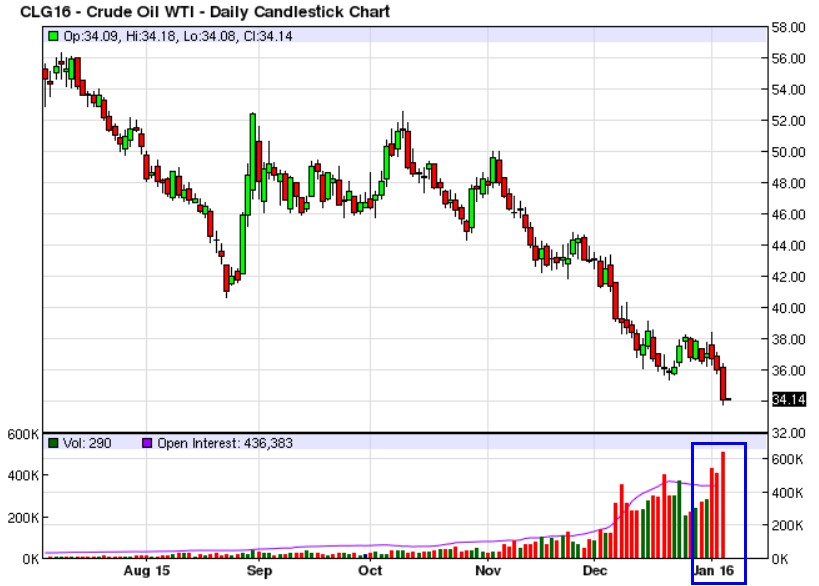
Volume of contracts traded is displayed at the bottom of the chart.
One Hell of a Collapse
That’s one hell of an impressive collapse from a daily, weekly, or monthly chart perspective. But is the bottom in? Some think it is.
For example, EconMatters writes That’s the Bottom in the Oil Market.
…