

By Ilene
Below are some insider buying/selling charts and reports discussing recent insider activity. Note that different publications measure insider buying/selling in different ways so the results do not correspond perfectly. Further, InsiderCow charts the Buy:Sell ratio while Paul Price and Insider Trade Reports monitor the Sell:Buy ratio. The insider Buy:Sell ratio has been relatively strong in 2016. And the inverse, the insider Sell:Buy ratio, has been weak.
Charts from InsiderCow.com.
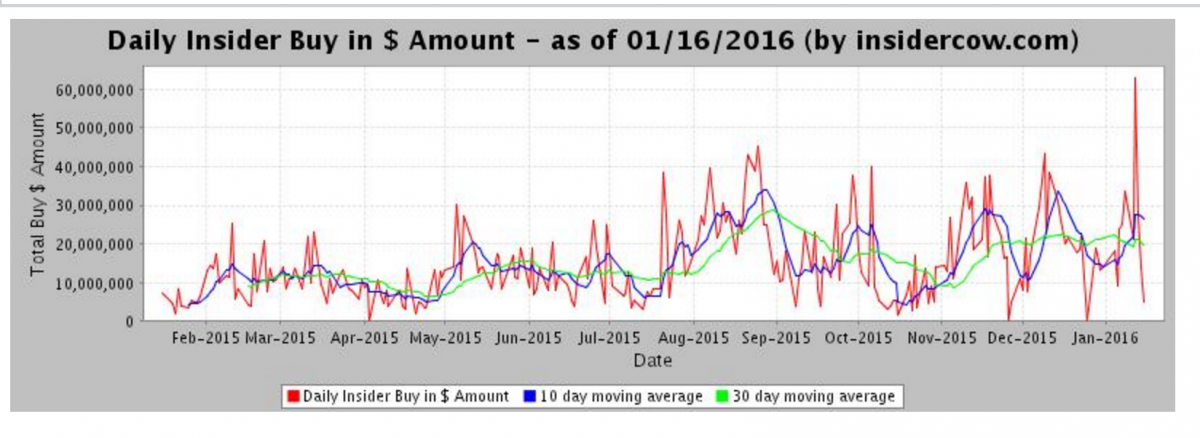
Insider Buying
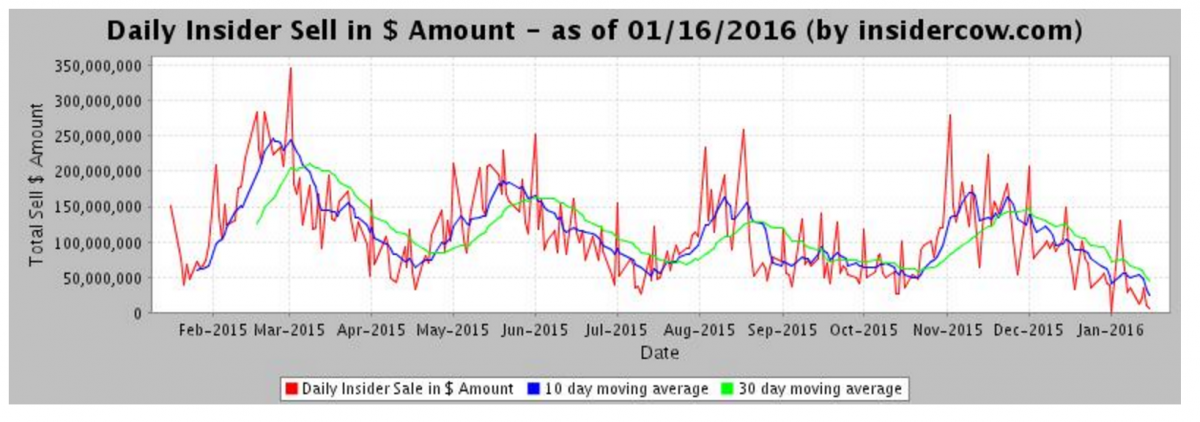
Insider Selling
The chart directly above shows how selling tends to concentrate post-earnings season. This is because insiders are typically barred from trading for a period before it's time to announce their earnings (source). Nevertheless, compared to the beginning of 2015, buying has been generally higher and selling has been generally lower, causing the buy:sell ratio to climb, as the chart below shows:
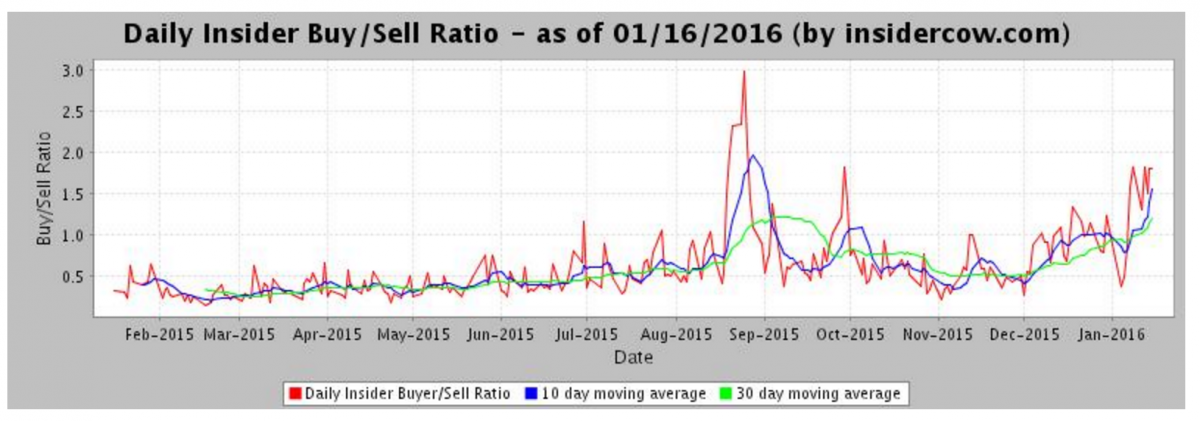
Buy:Sell Ratio
In It Pays to Notice Insider Buying, Paul Price notes:
Bullish levels [looking at the insider Sell:Buy ratio] such as seen in the week ended Jan. 15 are typically excellent trading opportunities for those with relatively short (weeks to months) time horizons.

The charts above show the correlation of five previous insider buy signals (labeled A through E) with subsequent sharp rallies. Will the latest market plunge and buying surge end with another good bounce back? History says it will.
Here is Barron’s list of recently reported substantial insider buys.

Similarly Asif Suria writes in InsiderTrade Reports:
Insider Weekends – January 15, 2016
Insider buying declined last week with insiders buying $66.27 million of stock compared to $132.61 million in the week prior. Selling also decreased with insiders selling $212.11 million of stock last week compared to $439.57 million in the week prior. This is the lowest amount of insider selling we have seen in over four years.
Sell/Buy Ratio: The insider Sell/Buy ratio is calculated by dividing the total insider sales in a given week by total insider purchases that week. The adjusted ratio for last week dropped to 3.2. In other words, insiders sold more than 3 times as much stock as they purchased. The Sell/Buy ratio this week compares favorably with the prior week, when the ratio stood at 3.31. We are calculating an adjusted ratio by removing transactions by funds and companies and trying as best as possible only to retain information about insiders and 10% owners who are not funds or companies.

Insider Sell Buy Ratio January 15, 2016
While these observations about insider activity do not guarantee future increases in the stock market, they are on the whole bullish signals.


