

Chart o’ the Day: JP Morgan on Margin Debt
 Courtesy of Joshua Brown, The Reformed Broker
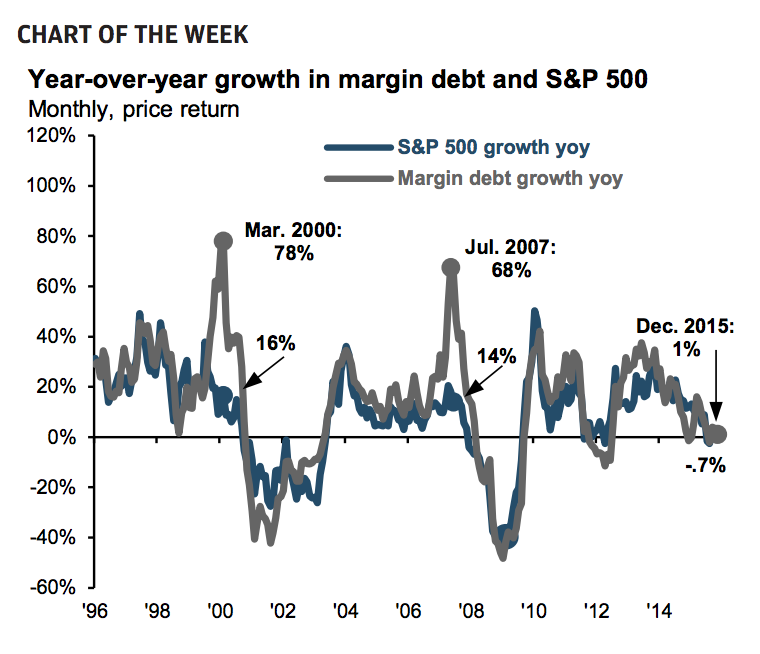
Is there a stock bubble being fueled by margin debt?
We’ve been debating this topic for a few years now. JP Morgan Asset Management takes a look at the rate of margin debt growth versus the two recent bubble tops of 2000 and 2007. They pick up on important difference between now and then that looking at the aggregate amount of margin debt wouldn’t show you:
It’s apparent that there was a severe dislocation between the two in both March 2000 and July 2007, with margin debt growing almost 5 times faster than the equity market, indicating that investor exuberance was not linked to market fundamentals. Today’s market looks much different, with margin debt only growing 1% over 2015 and the equity market falling just 0.7%. While overall margin debt levels look elevated, the growth rate in relation to equity market movements indicates that investors are being much more prudent about margin debt and that we are not witnessing a market similar to 2000 and 2007.
and the chart:
Source:
Weekly Market Recap
JP Morgan Asset Management – February 22nd, 2016