

Chart o’ the Day: Factor Performance By Year Quilt
Courtesy of Joshua M Brown
You may click to embiggen this awesome graphic from Charles Schwab via John Lunt via ETF Trends:
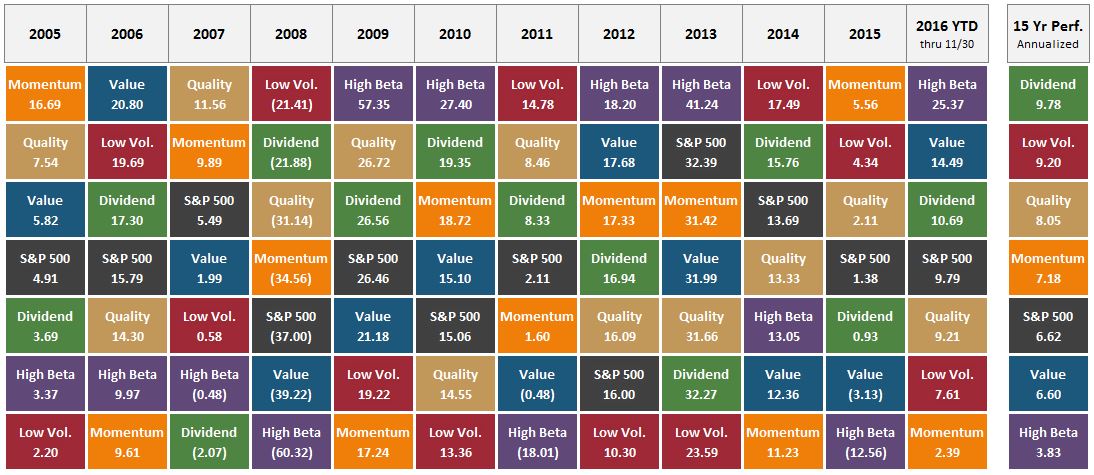
Josh here – it was a good year for value and a great year for high beta. Low volatility, the darling of the first half (according to fund flow data), has underperformed substantially. With any scheme to overload on specific factors, one of the key concepts is to be honest with oneself about the fact that they go in and out of favor just like sectors, industries and other categorizations of stocks.
No silver bullet, my friends.
Source: