

 And we're back!
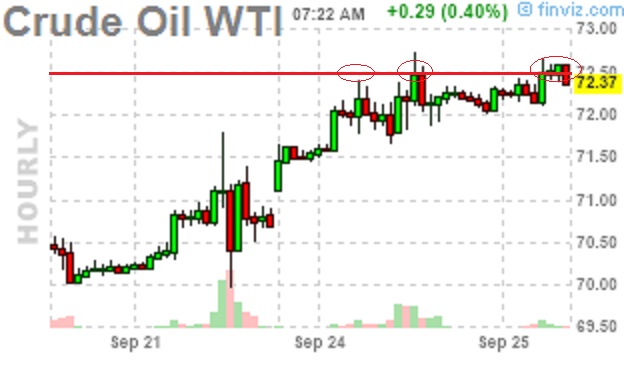
The Dow is up 75 points pre-market, back at 26,700 and the Nasdaq is testing the 7,600 line, which will certainly be bullish if they break over it but, until then, I like /NQ as a short with tight stops above. We also re-shorted Oil (/CL) Futures at $72.50 this morning – also with tight stops above as it sets a nice, positive risk/reward ratio to do so. We made $500 shorting /CL yesterday on an 0.50 drop and about the same on Gasoline (/RB) as it fell so no reason not to give them another chance to make us money, right?
Trade Wars are not good for oil demand and 74 out of 98 S&P Companies that have issued Q3 guidance so far have isssued negative guidance and that's already the worst rate since Q1 of 2016 when the S&P fell 15% from 2,100 to 1,800 as earnings rolled over. It's still early in the cycle but negatives outpacing positives 3:1 is certainly something we should be taking note of. Or, we can add it to the ever-growing list of negatives that investors are ignoring in this rally…
Insight/2018/09.2018/09.21.2018_EI/Percentage%20of%20Companies%20Issuing%20Negative%20EPS%20Guidance.png?t=1537864669380&width=910&name=Percentage%20of%20Companies%20Issuing%20Negative%20EPS%20Guidance.png)
Keep in mind that figure is WITH all the buybacks and WITH all the M&A activity and WITH the still-low interest rates and WITH what is still $60Bn/month in QE, though that may change on Wednesday if the Fed begins to pull back – as it has said it was planning to do.
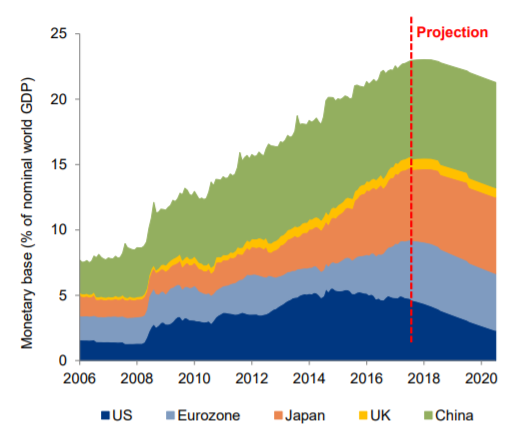 Though our Fed has begun to somewhat unwind their QE program, the rest of the World's QE is only just now hitting its peak, so of course the markets are at record highs when there are record amounts of money chasing equities but this (2018) should mark the end of the Global Liquidity Boom and now comes the reduction – a slow and painful process that will be with us for years as the Central Banksters race to drain the monetary swamp before all those Dollars lying around begin to turn inflationary.
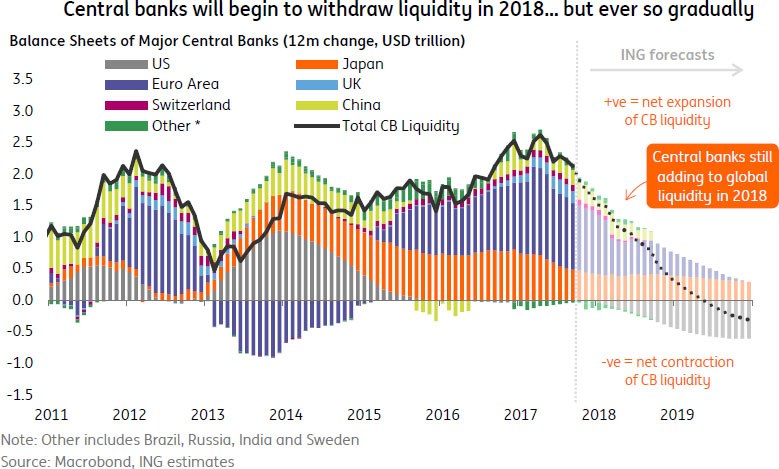
This is the greater market picture you need to be concerned with – it's the macro that will be driving the market for years to come – especially as the Central Banks, so far, have taken only the smallest of baby steps to begin unwining a decade of QE programs that have flooded the markets with liquidity and kept interest rates artificially low. As you can see from the next chart – we're still a year away from actually withdrawing stimulus but the entire World turns net negative in about the middle of next year:
Our own Fed is withdrawing stimulus at the same time that our Government is looking to borrow record amounts of money. Just this morning they will be selling $17Bn worth of 2-year notes and $35Bn worth of 5-year notes and Thursday they will sell $31Bn worth of 7-year notes and that's AFTER selling $35Bn worth of 3-year notes on the 6th along with $23Bn worth of 10-year notes and $15Bn worth of 30-year bonds. That's $156Bn just to Fund Trump's September deficit!
Most of those notes are now going for more than 3% and the "official" Fed Funds Rate is still "1 3/4 to 2 percent" so they are getting miles behind the curve and must raise rates at Wednesday's meeting or risk losing control of the narrative that the US can continue to borrow Trillions of Dollars at the 2nd lowest rates on the Planet (Japan pays less). This is what unraveled Greece – people simply stopped lending them money at a steep discount and that caused their debt to be downgraded, forcing them to offer more interest, which led to more downgrades, etc., etc…
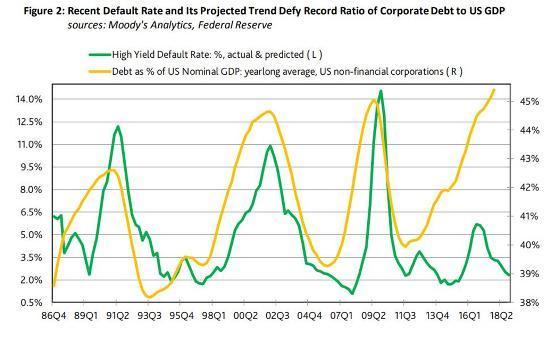 Corporate debt is also out of control as US non-Financial Corporations now owe a record $10Tn and they've been using that debt to buy back their own stock at a staggering rate. Last quarter alone, US companies bought back $189Bn worth of their own stock and the pace has been accelerating as the pressure to keep up profit appearances intensifies. That's not even including a rapid rise in M&A activity, which is like a buyback as you are deleting the stock of the company you are aquiring – giving your company more earnings per remaining share. It's a fantastic way to paper over years of inept management and anemic growth!
Southwest Airlines (LUV), for example, showed second-quarter Net Income excluding items declined 2.1% from a year ago. On a per-share basis, however, it ROSE 2.4%, in part because the company has repurchased 28.3M shares ($1.7Bn) in the past year – 5% of the company's stock. Southwest said its per-share earnings growth “has been driven primarily by the strong financial performance of our robust network.”
On any given day, LUV trades about 4.5M shares at $62, which is $279M but those trades are bought and sold at similar prices and the net flow of cash in or out of the stock is more like 10% of that number, call it $30M/day. Over 200 trading days that's $6Bn and the company pushed $1.7Bn of that in – that's 25% of all net trading or 33% of "real" trading – all added to the long side yet, for all that work – the stock is still at $62, after opening the year at $66.
These are distortions to a true picture of the market and lower taxes are a distortion as well as LUV paid $1.3Bn on $3.5Bn in earnings in 2016 but, for 2017, they got a $237M refund on $3.25Bn in earnings – do you count that tax benefit in for the long haul – or only until the next election? After all, these massive deficits don't grow themselves, you need to reduce revenues and increase spending at the same time.
What could possibly go wrong?