

Courtesy of Chris Kimble.
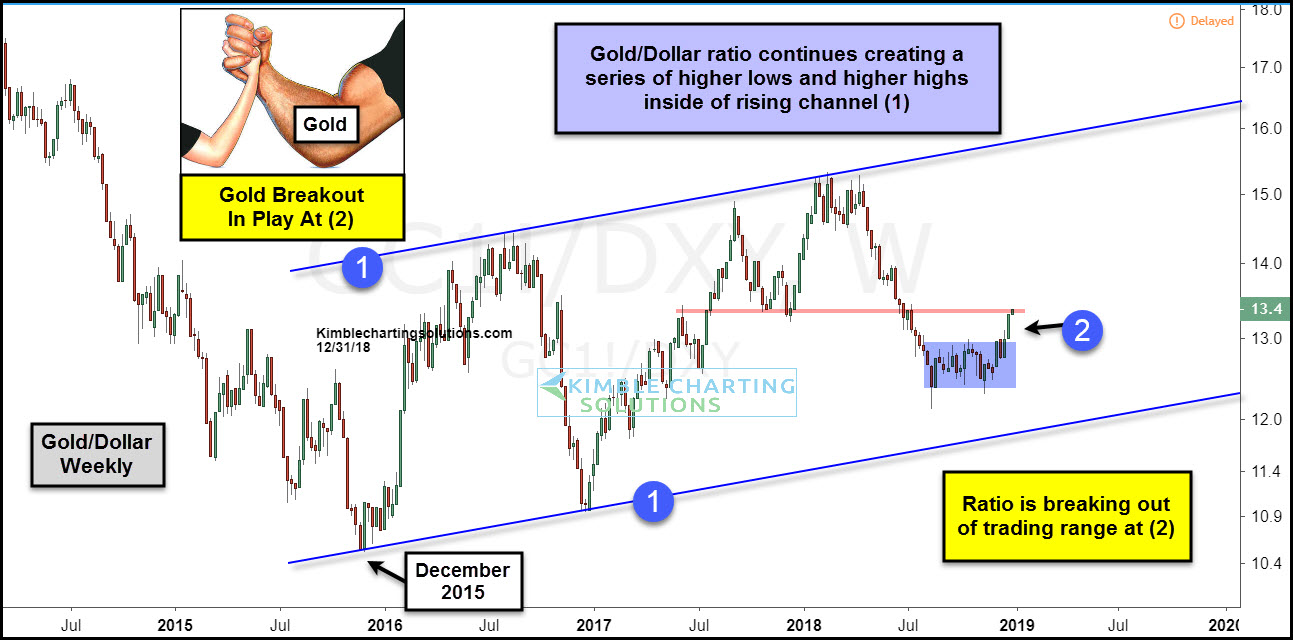
Since 2011, Gold has been much weaker than King Dollar. Over the past 3-Years, it is attempting to change the long-term trend.
This chart looks at the Gold/Dollar ratio over the past few years. The ratio hit a low in December of 2015 and has been creating a series of higher lows and higher highs inside of rising channel (1). The ratio hit the top of this new channel at the beginning of 2018 and declined through the summer.
Since the summer lows, the ratio has traded sideways inside of the blue box. Strength in Gold of late has it breaking above the top of this trading range at (2).
Gold, Silver, and miners have done well this month, while stocks around the world have been soft. The ratio is now testing the 2017 lows, which comes into play as resistance.
What the ratio does at this resistance test will send an important message to the metals sector for the next few months.
–
To become a member of Kimble Charting Solutions, click here.