

Courtesy of Pam Martens
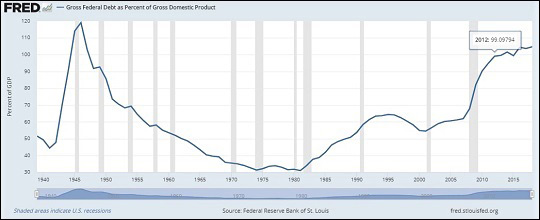
Gross Federal Debt as a Percent of GDP, January 1, 1939 to January 1, 2018 (Source: Federal Reserve Bank of St. Louis)
By Pam Martens and Russ Martens
The two greatest stock market crashes that triggered deep economic upheaval in the U.S. occurred from 1929 to 1932 and from 2008 to 2009. There has long been a debate as to why the 1929 crash was followed by a Great Depression while the 2008 epic crash, which took down century-old iconic names on Wall Street along with the U.S. housing market and labor market, was followed by a less severe Great Recession.
Another debate about those two periods is why the stock market, as measured by the Dow Jones Industrial Average, took a quarter-century to regain the peak it had set in 1929 while the stock market returned to the peak it had set in 2007 just six years later. (See charts below.)
We believe the answer is found in one word – debt.
On January 1, 1939, after more than nine years of the Great Depression and staggering unemployment, the U.S. Federal debt stood at just 51.58 percent of Gross Domestic Product. (The debt climbed to over 100 percent of GDP during the U.S. engagement in World War II but then declined sharply over the next three decades. See chart above.) But after the 2008 Wall Street collapse, Federal debt as a percent of GDP climbed rapidly, rising to 82 percent on January 1, 2009; to 99 percent on January 1, 2012; and climbing further to 105 percent as of October 1, 2018.
…