

Courtesy of Pam Martens
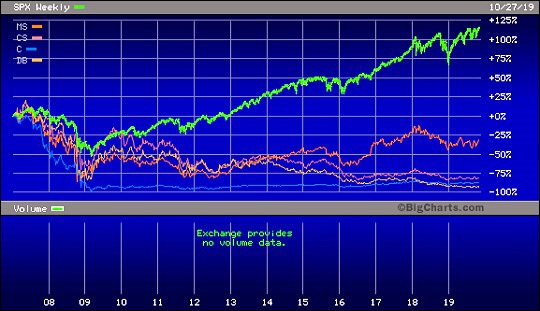
S&P 500 Versus Stock Prices of Morgan Stanley (MS), Credit Suisse (CS), Citigroup (C) and Deutsche Bank (DB) Since January 1, 2007
By Pam Martens and Russ Martens
Fed Chairman Jerome Powell had a Greenspan moment on Wednesday during his press conference. He made several Goldilocks statements about the banks that are going to come back to haunt him just as former Fed Chairman Alan Greenspan’s Alice in Wonderland remarks to Congress in the leadup to the greatest financial crash since the Great Depression have now made him appear to have been either lying to Congress or dangerously out of touch. It took just a few moments for us to pull up some charts to disprove the statements made by Powell.
Powell stated the following during the Q&A portion of the press conference:
“So, we monitor financial stability risks very carefully all of the time. It’s what we do since the financial crisis, as I’ve mentioned before. Currently, we don’t see large imbalances. This long expansion is notable for the lack of large financial imbalances like the ones we’ve seen certainly before the crisis happened.”
If the Fed and Jerome Powell aren’t seeing large imbalances, it’s simply because they aren’t looking or they are consciously choosing to stick their heads in the sand.
…