

Courtesy of Chris Kimble
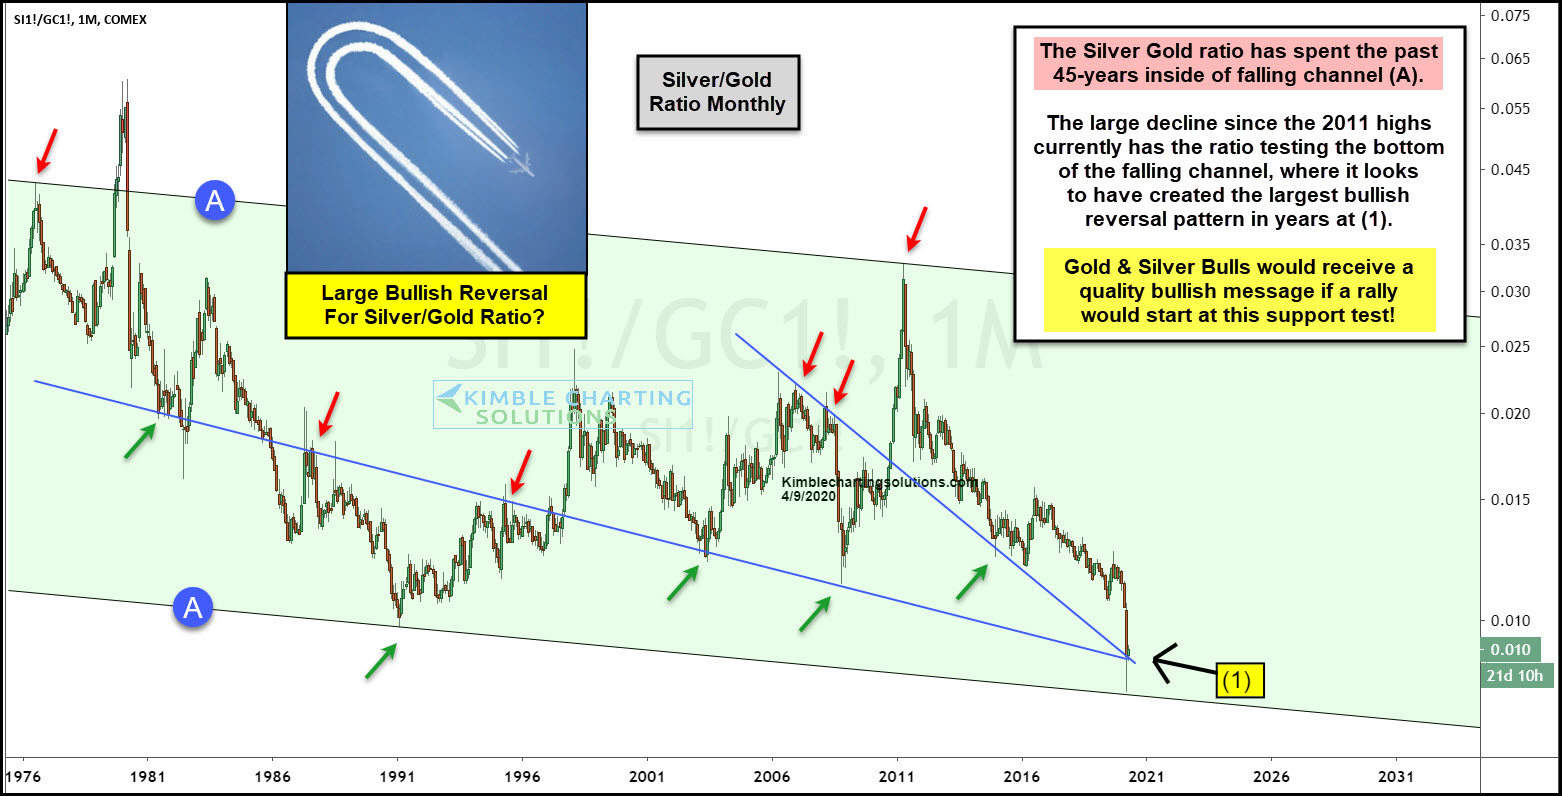
Is an important metals indicator sending one of the largest bullish messages in nearly 50-years? Very Possible!
This chart looks at the Silver/Gold ratio on a monthly basis since the mid-1970s. Historically metals bulls want to see the ratio heading up, to send the metals complex a solid bullish message.
The ratio hit the top of the falling channel (A) back in 2011, where it created a large bearish reversal pattern. Since creating the bearish pattern at resistance, the ratio has experienced a significant decline.
9 years after hitting the top of the channel the ratio hit the bottom of the channel at (1) last month, where it looks to have created one of the largest monthly bullish patterns in decades while testing channel support.
No doubt the trend remains down and this bullish pattern did not reverse the 9-year trend. It does lay the groundwork that a bottoming process could be in the making while testing the bottom of this multi-decade channel!
Are we headed towards very tough times or is the worst behind us? See why Joe Friday thinks this indicator will tell us the answer!
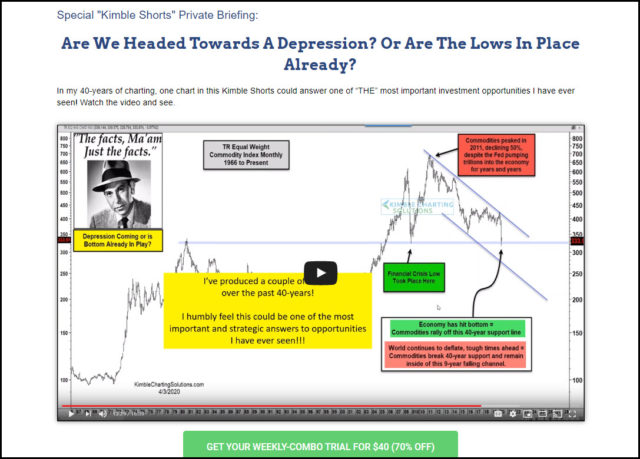
See our thoughts in this video and how to take advantage of our 40-year anniversary special.
To become a member of Kimble Charting Solutions, click here.