

Courtesy of Chris Kimble
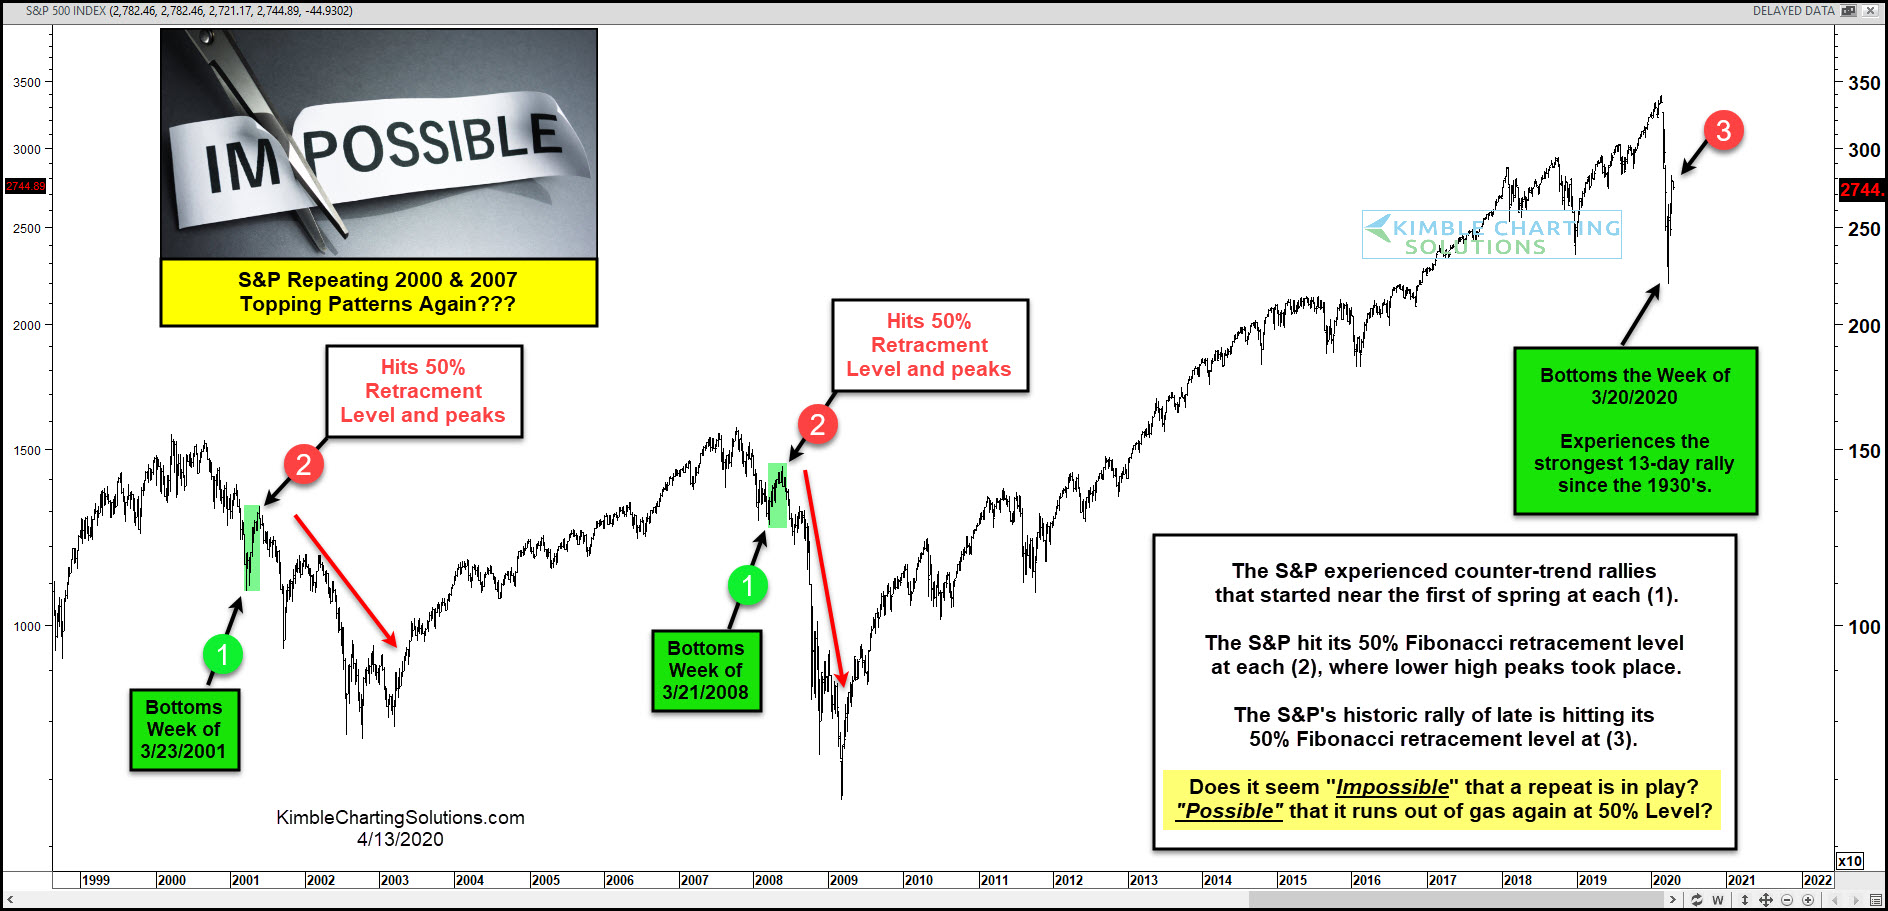
S&P 500 Index Chart Long-Term Chart
Over the past two weeks, the stock market has rallied sharply, seeing the S&P 500 retraced 50 percent of the 2020 market crash.
The quick burst higher has many feeling a sense of relief… but could this be an ominous sign?
In today’s chart, we look at the S&P 500 Index over the past 20 years and the prospective of repeating bearish patterns in both time and price. Note that I pointed out this possibility in my April 6 article.
The past two market crashes in 2000 & 2007 saw the broad stock market index put in a March low at each (1) before rallying and peaking at its 50 percent Fibonacci retracement level at each (2). This then lead to an acceleration of selling and new bear market lows.
Stock Market Crash Deja Vu?
Could this be happening again this year? The S&P 500 put in a crash low in March before rallying back to its 50 percent Fib retracement level at (3).
Is history repeating right on time? Is the bear market rally setting up a giant bull trap? Bulls sure hope not. Stay tuned!
This article was first written for See It Markets.com. To see the original post CLICK HERE
To become a member of Kimble Charting Solutions, click here.