

Courtesy of Chris Kimble
The March crash was pretty much an everything crash.
But nearly as fast as the market crashed, it’s come back.
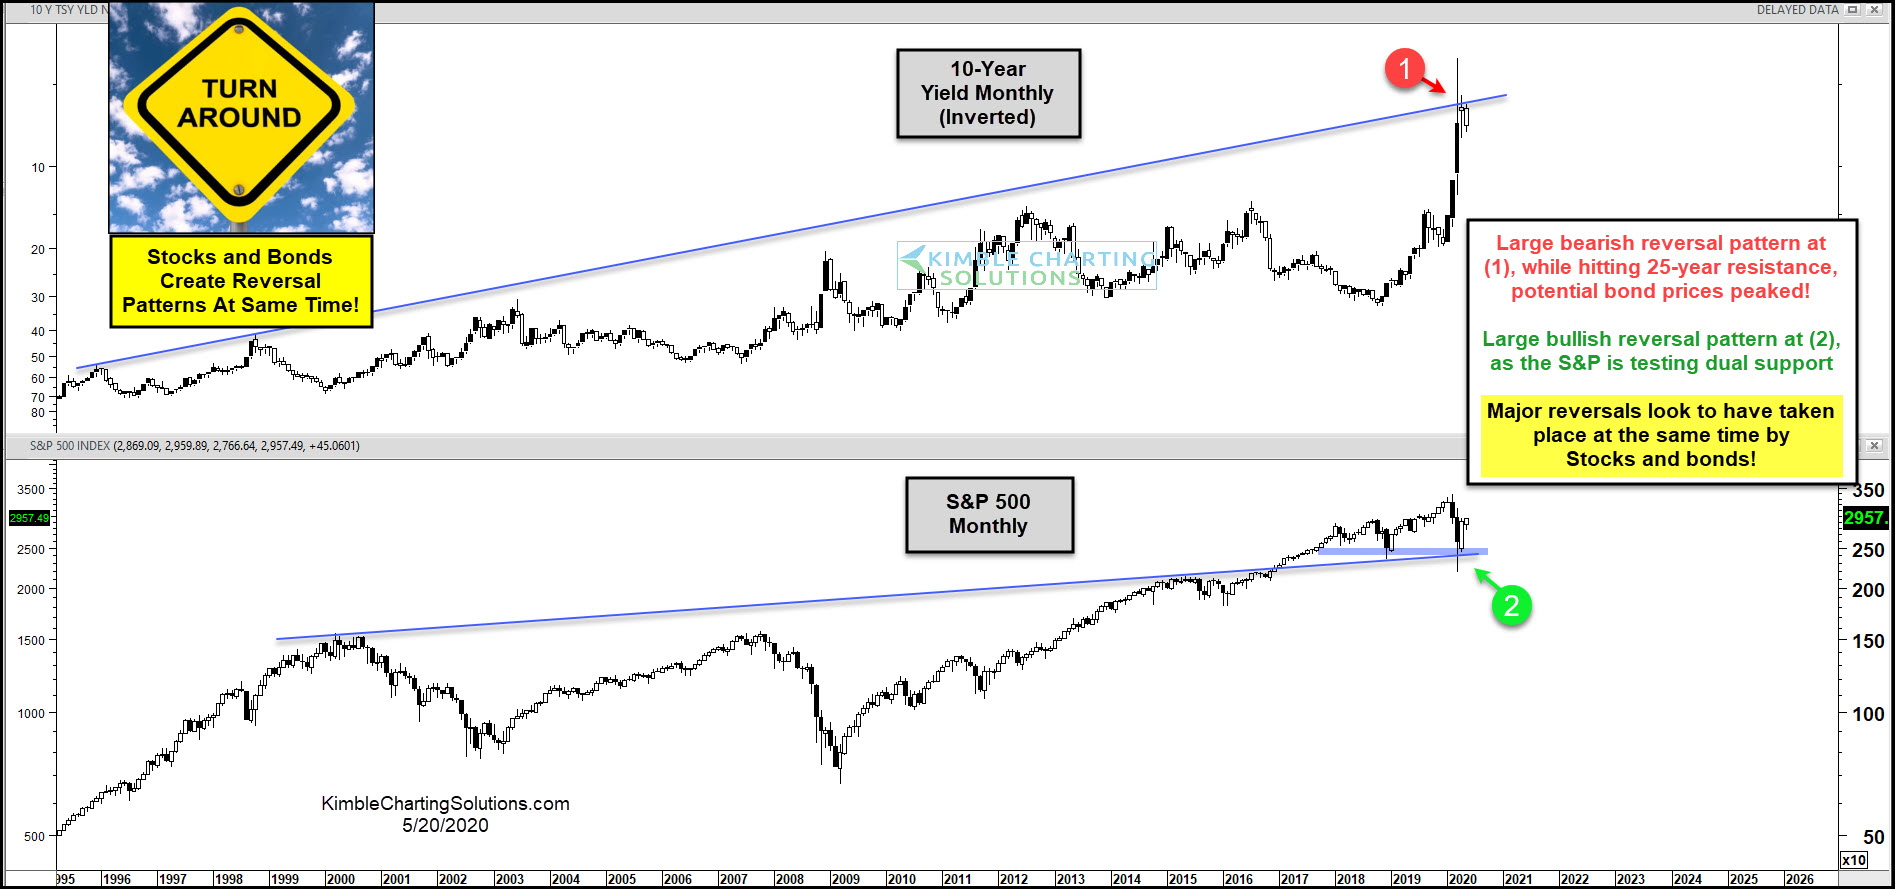
In today’s chart, we look at two very important asset classes: stocks and bonds. Stocks are represented by the S&P 500 Index and bonds are shown by an inverted chart of the 10 Year US Treasury Bond Yield.
As you can see, both stocks and bonds put in large reversal patterns at key trend support/resistance at the same time. [Inverted] Bond yields at (1) and the S&P 500 Index at (2).
Is this the mark of a turnaround? Bulls hope these reversals hold.
Where would these reversals fail and send a bearish message to stocks and a bullish message to bonds? For stocks, it would be a break of support at (2) and bonds it would be a breakout at (1)!
This article was first written for See It Markets.com. To see the original post, CLICK HERE.
To become a member of Kimble Charting Solutions, click here.