

By Pierre Raymond. Originally published at ValueWalk.
Welcome to the first company financial statements update of the new (second) quarter. First to appear are financial statements of companies with fiscal years ended April and fiscal quarters ended May. Financial statements of the larger volume of companies with fiscal quarters ended June will appear in the last week of July and the first week of August.
Q2 2020 hedge fund letters, conferences and more
For now, buy and sell reports are returned to neutral as we anticipate a unique quarterly update in the coming weeks. Evidence appears of a growth leadership shift away from the technology dominated sector towards commodities and industrials. This is a good time to review index and sector growth potential.
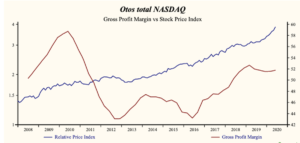
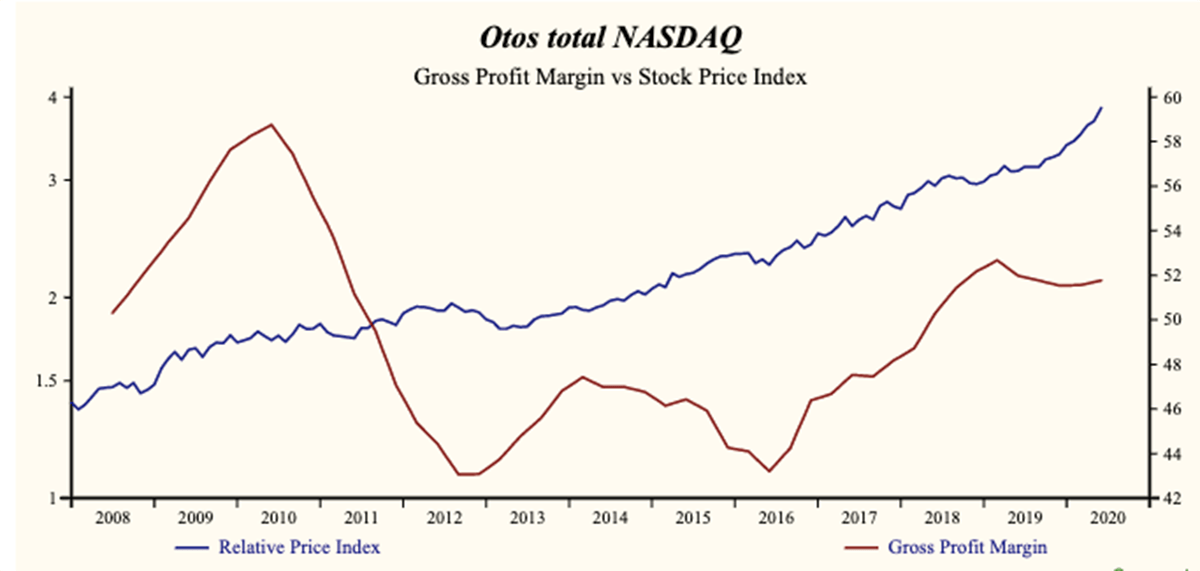
Otos Total NASDAQ Index
The share price index of the Otos Total NASDAQ Index has advanced by 102% relative to the Otos Total Market Index since the April, 2013 low. Current relative price-to-sales is about mid-range in the record of the Index.
Last week the share price index of the Otos Total NASDAQ Index fell by 1.2% compared to a 2.9% decline for the Otos Total Market Index. Gaining stocks in the Otos Total NASDAQ Index numbered 156 or 21.0% of the Index Total compared to a 9.4% gaining stocks frequency across the 3,979 stocks in the Otos U.S. stocks universe.
We have collected First quarter 2020 sales data for 732 of the 744 comparable record companies in the Otos Total NASDAQ Index representing 100% of the capital value. The Index capital weighted average sales growth rate is 11.1%. The proportion of Index market capital accounted for by rising sales growth companies is up to 60.2%, compared to 57.4% last quarter.
Currently, sales growth is low in the record of the Otos Total NASDAQ Index but higher than last quarter.
The proportion of total market capital accounted for by rising gross profit margin companies is down this past quarter to 53.5% compared to 63.9% of the previous quarter.
Poor-Quality Growth Trend
The Index is recording a high and stable gross margin. Inventories are down, improving the chance of a future increase in the gross margin. SG&A expenses are high in the record of the Index and falling. That implies that the Index has further capability to accelerate EBITDA relative to sales with lower costs. SG&A expenses are falling at a more rapid rate than the gross margin; producing a rising EBITDA margin.
This is a poor-quality growth trend to the extent that lower costs can insulate the bottom line from top line weakness for only a short time. Interest costs are high in the record of the Index and falling. That implies that the Index has further capability to accelerate earnings relative to sales with lower financing costs. Lower interest costs also diminish financial risk and are often associated with higher share valuation. Choose to invest wisely among stocks of companies that have cash (Green Leaves), solid fundamentals (Healthy Tree Trunk) and financial stability (Stable Pot).
The more stable the pot appears, the better the attributes. Green and gold are good. Red is bad and the more intense the red the more urgent the call to action.

The post NASDAQ Index Q1 Review appeared first on ValueWalk.
Sign up for ValueWalk’s free newsletter here.


