

Valuation since the late 1990’s – win any argument with your friends!
Courtesy of Joshua M Brown
JPMorgan Asset Management’s new On The Minds of Investors piece takes a look at “framing”, a behavioral bias that affects our judgments about market prices. Where you choose to start counting from will have a big impact on how you feel and what arguments will appeal to you.
For instance:
What level of returns should we expect from equity markets? The answer changes depending on the time period – when investors allow an incomplete picture to influence their decisions, it is an example of framing. While it appeared the market had climbed to untenable highs post-GFC (Exhibit 1), if we take a slightly longer view, the overall market return was actually flat between 2000 and 2012. During that time period, the market had an average annual total return of 0.6% per year and a cumulative total return of 6.8% – effectively a sideways market.
JPM’s Samantha Azzarello notes that if you were simply move the frame and look at returns from March 2009-March 2020, you’d see 18.5% annually for the S&P 500, a remarkable run compressed into that 11 year period of time – the opposite of the 2000-2012 experience.
So here’s our Chart o’ the Day for today:
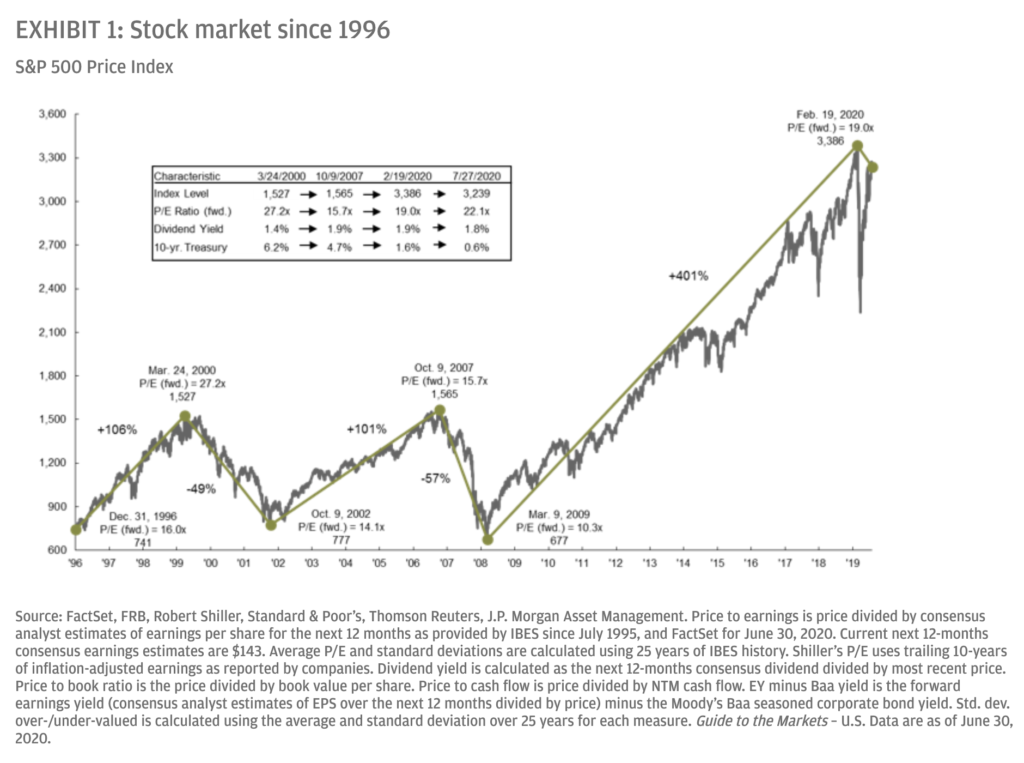
Josh here – beside the framing issue, which allows you to win any argument with your friends that you’d like (it’s run too far! No, it’s got room!) what I find most interesting is the wide variety of market multiples since I began investing and trading in the late 1990’s.
I’ve seen forward PE’s for the S&P 500 range from a high of 27 early in my career to a low of 10! Which tells you that even if you could guess at the earnings of the market a year ahead of time, it would be impossible to figure out exactly what price multiple your fellow investors will put on that earnings number through the process of their buying and selling. And it’s not as though you could actually guess the earnings number anyway.
So now imagine how hard it is to calculate a year-end forecast, with those two variables sloshing around all year, one based on changing fundamentals and the other based on changing sentiment. Cannot be done!
Source:
Framing: How do investors interpret equity market returns over time? (JPMorgan Asset Management)