

Has the FTSE 100 really performed as badly this century as it appears?
Courtesy of Enrico Onali, University of Exeter
Apple has become the first company worth US$2 trillion (£1.7 trillion), meaning that it is now more valuable than all the companies in the FTSE 100 (they add up to £1.5 trillion). This is extraordinary news about one American tech company, but it also points to the fact that FTSE 100 share prices have performed poorly against rival indices around the world for several decades. As we shall see, however, it’s a more complicated story than it first appears.
If an investor had bought £1,000 of the shares of all the companies on the FTSE 100 on January 31 2001 and sold them on July 31 of this year, she would have lost £63.48, a price return of -6.3%, even before you take inflation into account.
This was at least a better performance than one major index, the Euro Stoxx 50. The constituents of this index are blue-chip companies from nine eurozone countries (Belgium, Finland, France, Germany, Ireland, Italy, Luxembourg, the Netherlands and Spain). Investing in this index in the same period would have reduced your pot by 33.6% (that’s £664 for your £1,000 investment after 20 years).
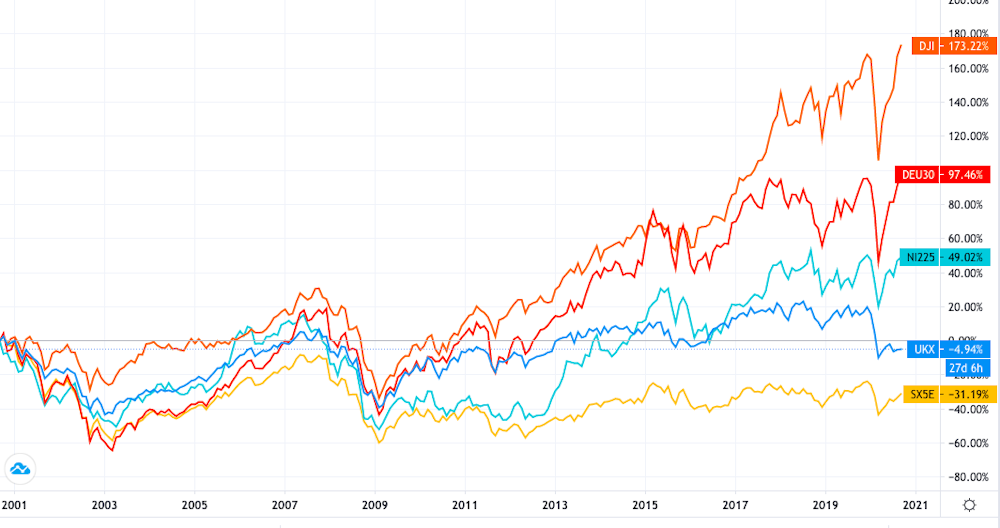
But both the FTSE 100 and Euro Stoxx 50 compare poorly against other international indices, as can be seen in the graph below (click on it to make it bigger). Over the same period, Japan’s Nikkei 300 went up 17.9%, Germany’s DAX achieved 81.2%, and the American Dow Jones Industrial Average achieved 142.7%.
Stock indices compared
Making sense of the numbers
To some extent, the FTSE’s poor performance can be explained by external forces. If we only look at the period from January 31 2001 to May 31 2016, the month before the European referendum, the FTSE 100 was only down 1.1% (instead of our 20-year -6.3%). This was relatively better compared to the Euro Stoxx 50, which achieved -35.9% over that period. And although the pre-referendum FTSE 100 was still much worse than the Nikkei, DAX and Dow Jones, it is less so than before: their respective rises over the same period are 5.2%, 51% and 63.3%.
Even then, there have been several mitigating factors for the FTSE 100 since the Brexit vote. It reached an all-time peak in May 2018, buoyed by a weaker pound and a truce in the trade war between the US and China.
It has also performed particularly poorly since the COVID-19 outbreak. From January 2001 to January 2020, the FTSE 100 was actually up 15.7%. The Euro Stoxx 50 was down 23.8% over the same period, while the Nikkei, DAX and Dow Jones achieved 30.6%, 91.1% and 159.5% respectively.
This means that Brexit and COVID-19 might explain some of the poor performance of FTSE 100 companies in the last two decades. But what other factors are in play?
The companies in the FTSE 100, especially the biggest ones, tend to belong to traditional industries such as pharmaceuticals (AstraZeneca and GlaxoSmithKline), banking (HSBC), mining (BHP), and oil and gas (Royal Dutch Shell and BP). The exposure of the index to the banking industry has perhaps been particularly detrimental to the performance of the FTSE 100.
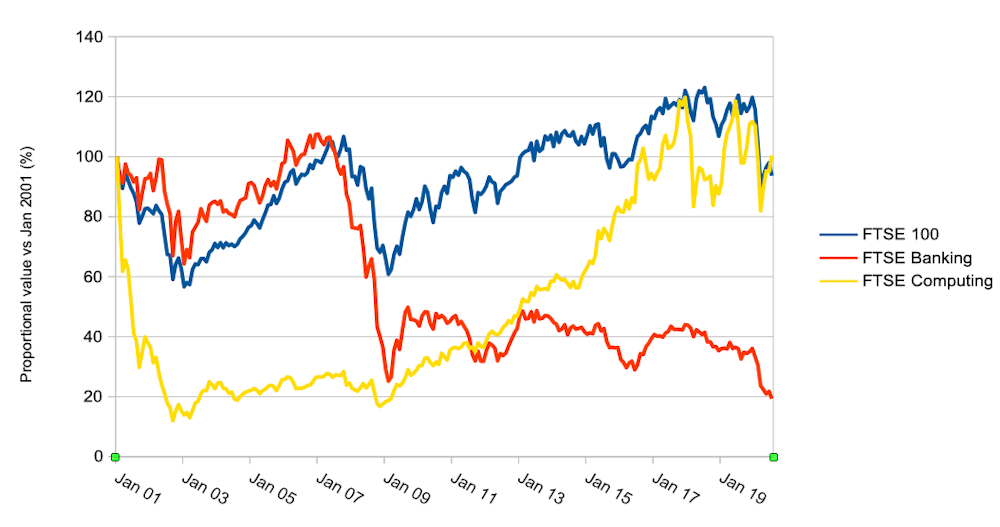
The graph below plots the performance of the whole index against the performance of its banking and computing stocks. As you can see, banking stocks have performed particularly badly in the last two decades. For example Barclays’s stocks have lost around 48% of their value since 2001. One of the reasons for such a poor performance, in addition to the financial crisis, is likely to be that low interest rates have squeezed banks’ profit margins.
Total FTSE 100 vs banking and computing stocks
Another potential reason for the underperformance of the FTSE 100 is that there are very few IT companies. Tech stocks like Apple and Microsoft have a very large weighting in the US, but their UK-listed equivalents represent a very small weight in the FTSE 100.
The reason why the share prices of IT companies tend to perform better is that they are usually younger and thus have stronger growth opportunities. True to form, the IT companies on the FTSE 100 have performed relatively well in the past decade, even if they have been quite volatile in the last couple of years, probably because of the uncertainty related to the threat of a no-deal Brexit.
For example, Avast is a Czech company that has been listed in London since May 2018. Since then, the stock price has grown by around 130%.
But it’s not only very young IT companies that have strong growth opportunities. Aveva is another FTSE 100 company listed in London, having been founded in 1967 in Cambridge as a government-funded research institute. Its annual average growth in stock price has been 182% since 2001.
Small caps and dividends
But if these factors have all played a role in why the FTSE 100 has compared poorly in price terms, there are several other important caveats that rather change the picture. First, the weakness has mainly been with the large blue-chip companies listed in the UK.
You can see this when you look at the FTSE 250, which is an index of smaller companies that tend to be based the UK rather than having the international dimension of the FTSE 100. Over the same 20-year period, the FTSE 250 is up 51.4% – well ahead of the Nikkei and not far behind the DAX.
Second, we have so far only looked at the raw price return of the FTSE 100. This ignores the fact that traditional companies of the kind that dominate the FTSE 100 also distribute dividends. To get a full view of companies’ performance, you have to factor these in too.
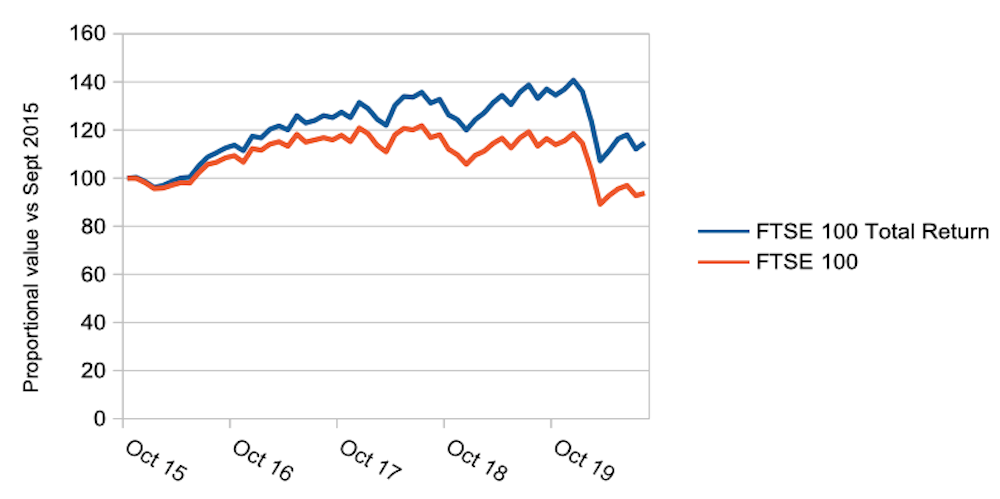
According to the calculations here, the same £1,000 invested into the FTSE 100 that we talked about at the beginning of the article would have approximately doubled over the last couple of decades if you included the income from dividends and continually reinvested it back into companies in the index. Below is a chart to show the comparison over just the last five years.
FTSE 100 Total Return vs FTSE 100
Though you would have to obtain the same data for our other indices to make a truly fair comparison, and I couldn’t source it all at the time of writing, the German DAX actually does include dividends in its numbers. So since it achieved 81.2% in our 20-year period, the UK returns turn out to be fairly similar.![]()
Enrico Onali, Professor of Finance, University of Exeter
This article is republished from The Conversation under a Creative Commons license. Read the original article.