Courtesy of Chris Kimble
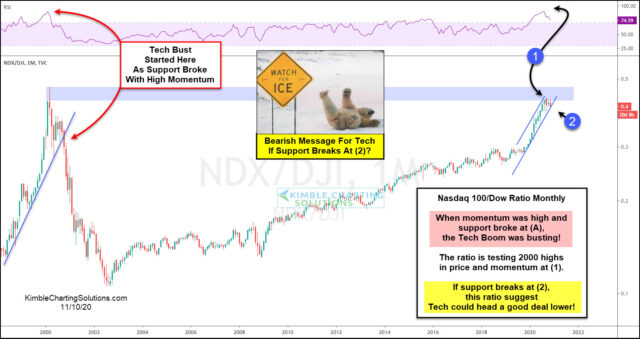
Twenty years ago the NDX 100/Dow Jones Ratio created a topping pattern, as monthly momentum was sky-high, as the Dot.com peak was taking place. Following this setup, the NDX 100 fell nearly 90% in less than three years.
The NDX/Dow ratio over the past 90-days is testing the 2000 highs as momentum is back at 2000 highs at (1).
The ratio is currently testing 8-month rising support at (2).
The ratio would send at least a caution message, possibly a bearish message, if the ratio breaks support at (2), as momentum looks to be rolling over!
To become a member of Kimble Charting Solutions, click here.


