

Courtesy of Chris Kimble
Over the years, active investors turn to several indicators to gauge market returns. And these indicators are used over varying timeframes, depending on the data and chart duration.
We often look to price patterns to highlight strengthening trends (breakouts) and trend reversals.
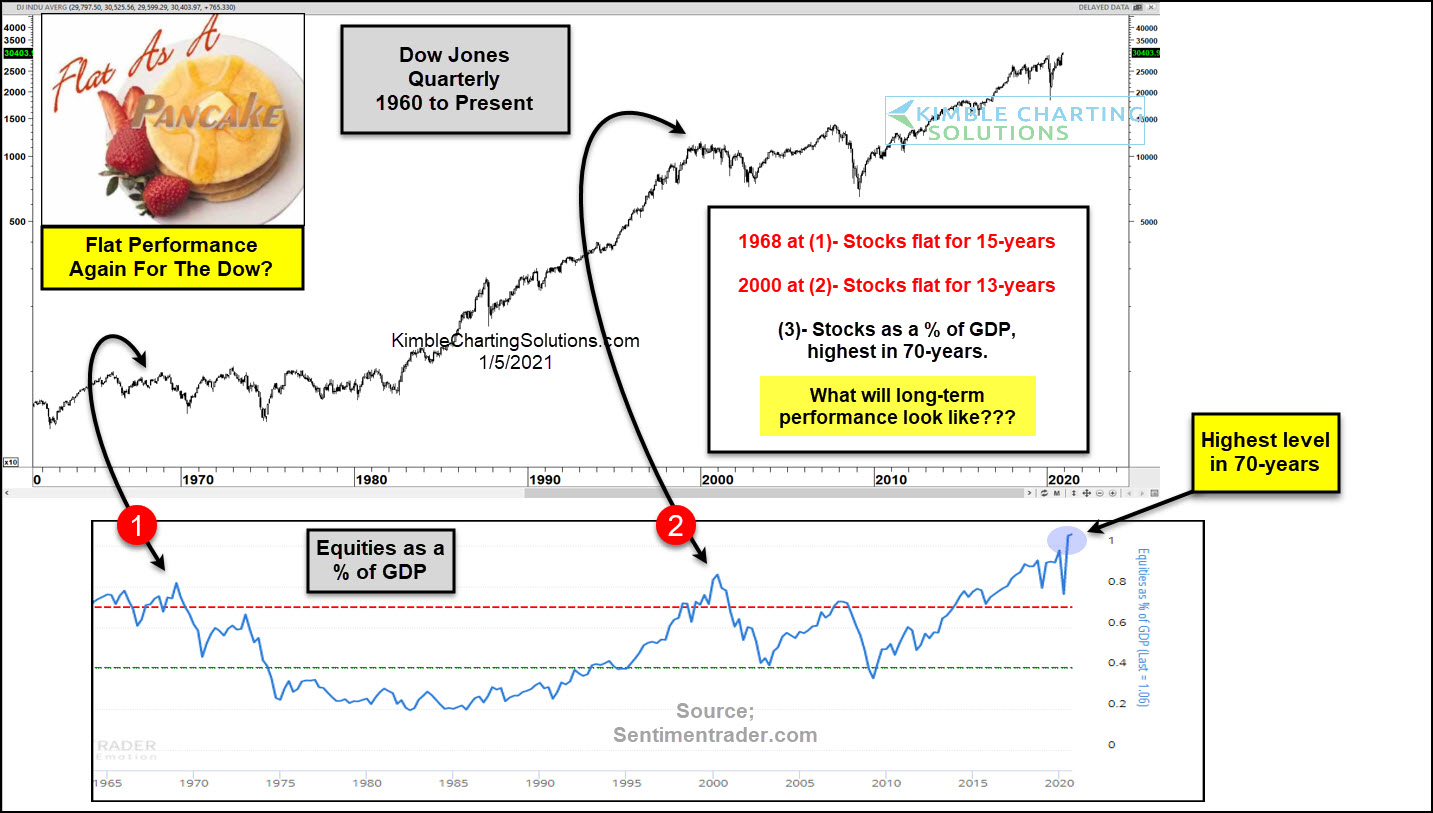
Today we look at a unique indicator and marry it up with a long-term “quarterly” chart of the Dow Jones Industrial Average. The indicator is Equities (i.e. stocks) as a percentage of GDP.
So why is this important to follow? Because when it peaks, it tends to forecast a flat performance for the Dow Industrials… perhaps for a decade or more.
As you can see, the last two times this indicator peaked, 1968 at (1) and 2000 at (2), it lead to flat performance on the Dow Jones Industrial Average for 15 and 13 years, respectively.
This indicator is currently at its highest level in 70 years! Is this a “new normal” or something to worry about? Stay tuned!
This article was first written for See It Markets.com. To see the original post CLICK HERE.
To become a member of Kimble Charting Solutions, click here.