

By Jacob Wolinsky. Originally published at ValueWalk.
Logica Capital commentary for the month ended January 31, 2022.
Q4 2021 hedge fund letters, conferences and more
Logica Absolute Return (LAR) – Upside/Downside Convexity – No Correlation
- Tactical/dynamic balanced Put/Call allocation – Straddle
Logica Tail Risk (LTR) – Max Downside Convexity – Strong Negative Correlation
- Tactical/dynamic downside tilted Put/Call allocation – Ratio Straddle
Summary
January saw the first real threat of correction in markets since Q1 2020. Technically, it was the first material breach of the S&P 500’s 200 day moving average since Q1 2020. Although implied volatility rose, it did not rise as substantially as one might expect given the size of the move in the underlying. And to end the month, markets rallied into the final days and implied vol crushed significantly.
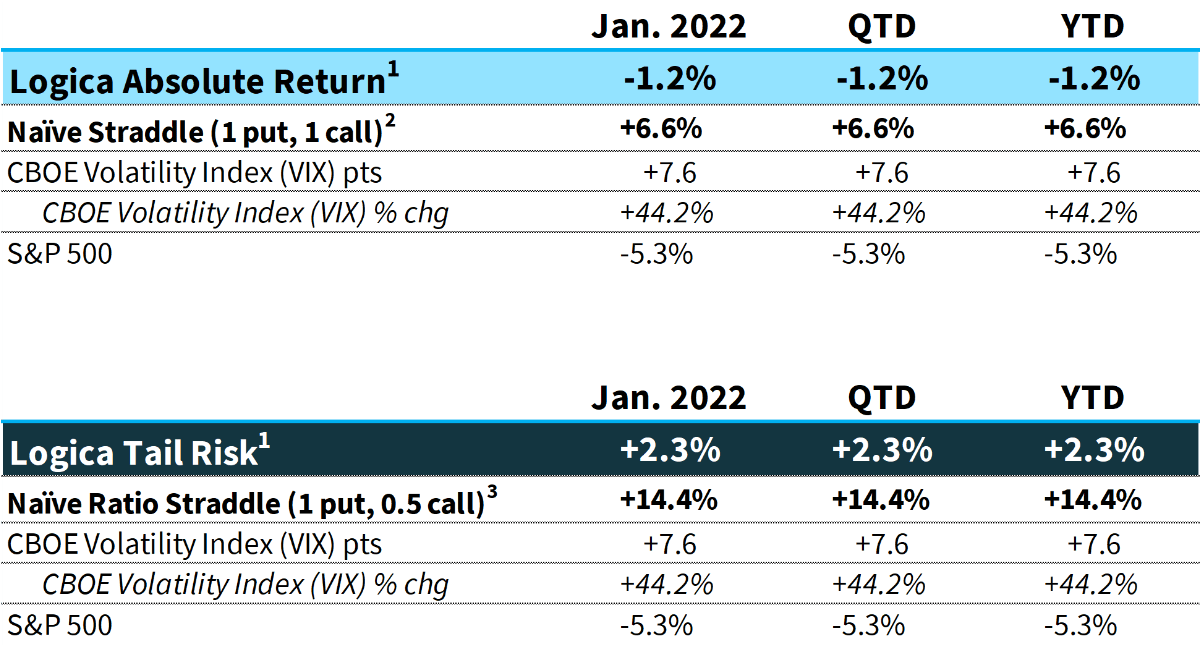
1 Returns are net of fees and represent the returns of Logica Absolute Return Fund, LP and Logica Tail Risk Fund, LP
2 Naïve Straddle Return: a 1.5 month out, S&P 500 at-the-money put and call bought on the final trading day of prior month and sold on the final trading day of current month. This return on premium is divided by a factor of 6 to be comparable to Logica’s typical AUM-to-premium ratio.
3 Naïve Ratio Straddle Return: a 1.5 month out, S&P 500 at-the-money put and at-the-money call (divided by 2) bought on the final trading day of prior month and sold on the final trading day of current month. This return on premium is divided by a factor of 6 to be comparable to Logica’s typical AUM-to-premium ratio.
Commentary & Portfolio Return Attribution
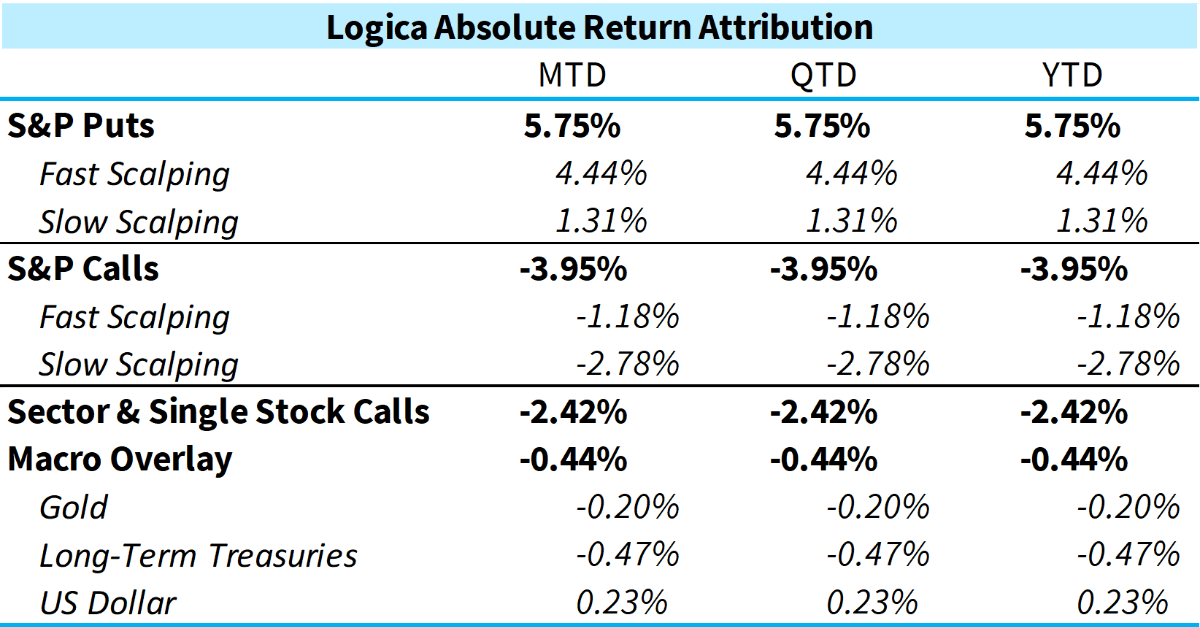
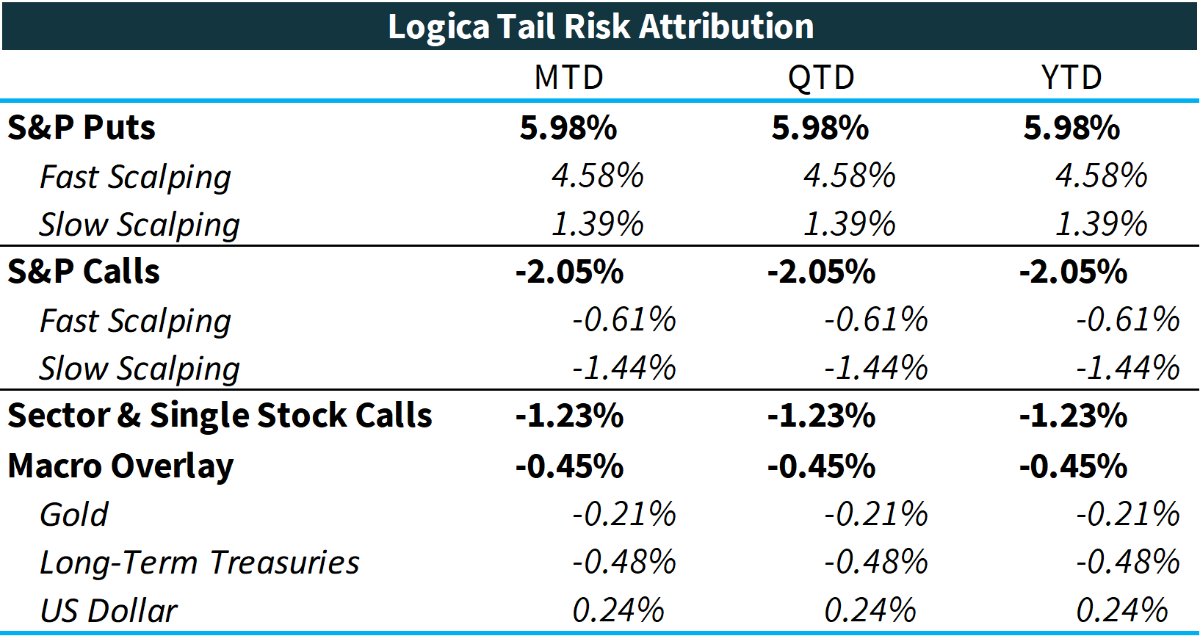
*Attribution returns are composed of daily returns, gross of fees
Sector & Single Stock Calls
As expected with indices down and vol up, Puts performed well while Calls detracted. Sector & Single Stock Calls had a very interesting month, with our growth/momentum bucket underperforming the S&P 500 (-10.76% as a standalone) as indices such as the NASDAQ 100 suffered a steeper drawdown than the S&P 500. On the other hand, our defensive long exposures, Logica Focus Diversified (“LFD”) had a phenomenal month vs. the S&P500, losing only -1.19% as a standalone. We can lament the underperforming bucket, or praise the outperforming one, but clearly this is the goal – and expected result – of thoughtful diversification. Broadly, our Sector & Single Stock Calls tend to have a bit more total delta notional exposure than our S&P Calls, so the fact that they contributed far less negative on the month is satisfying.
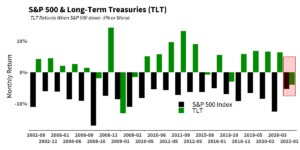
On the other hand, we can lament the performance of our Macro Overlay. We expect this bucket to perform in months like January (when equities sell-off reasonably), so were quite disappointed that not only did it not provide a nice tailwind, it also meaningfully detracted from performance. Specifically, long-term Treasuries had one of their worst months in decades, with respect to performance conditional on a drawdown in the S&P 500. Below we show, since 2002, calendar month returns of the iShares 20 Plus Year Treasury Bond ETF (TLT) when the S&P 500 is down more than 5%:
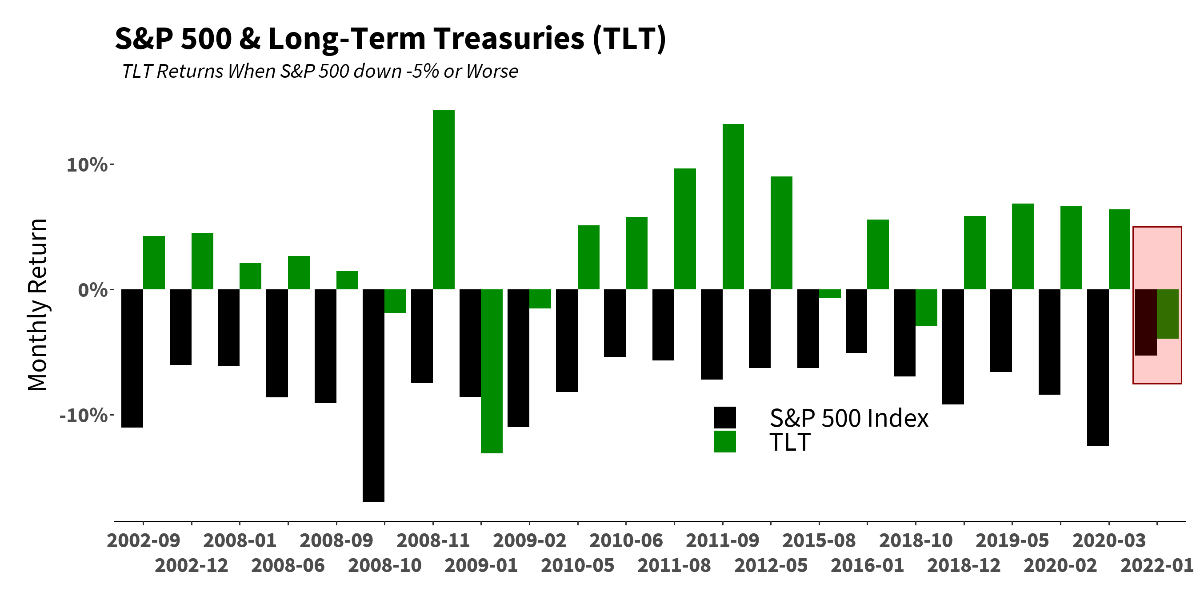
Not only is TLT consistently positive and rarely negative in these months, in only one other month in the last 20 years did TLT have a worse return than January 2022 given the S&P down -5% or more. This was January 2009. And, to boot, directly preceding that month, in December 2008, TLT was up +12.9%, and simply gave back that return. Obviously, we aren’t in quite the same environment at present, and so the lack of hedge/flight-to-safety is disappointing. It may, however, give us some insight into the fact that Treasuries are de-coupling from “risk off” exposure and may not offer the same benefits going forward. This recent behavior was, in fact, strong evidence (in terms of the outlier nature) supporting broader concerns around Treasuries that we’ve been discussing for many months now alongside extensive research we’ve been doing on our overlay. To this end, given the recent poor counter-equity behavior, as well as our concerns around the QE tailwind turning into a QT headwind (as discussed in prior letters), we have cut a substantial amount of our Treasury exposure, and are adjusting the portfolio accordingly.
Given that Treasuries seem to not only be more “expensive” (in terms of carry potentially converting from a tailwind to a headwind going forward) but are also exhibiting less reliability as an equity hedge, the obvious alternative for us is to simply forgo the proxy in favor of the real thing: S&P Put Options! Many years ago, when Treasuries were a “cheaper” alternative (during QE), and repeatedly demonstrated risk-off benefits, the proxy made good sense. Reasonable negative correlation, plus some convexity during risk events, at postive carry made us willing to exchange the more pure negative correlation of S&P Puts in favor of slightly less negative correlation. However, if Treasuries dramatically lose their negative correlation (or, perhaps worse, have a wildly unstable and unreliable correlation), plus, come with a flat/negative drift, the decision becomes easy. And, of course, as we already trade S&P puts, our models simply adjust the inventory to achieve the desired down-capture balance.
Of interest on the more quantitative side, the way our models view this exchange is in terms of Gamma/Theta, that is, how much Gamma (or convexity) is one getting for the expected Theta (or carry). While in Black-Scholes this trade-off is pure (the two sides of the equation balance perfectly), the real world doesn’t always behave like this, both if the underlying has more convex upside potential and/or if the underlying serves as a proxy. In the case of a potential proxy, if the ratio of Gamma/Theta (or convexity/carry) is materially better, but the proxy comes with some basis risk to S&P drawdowns, the trade-off might be worth it. But if the basis risk dramatically increases, and the proxy loses material reliability to S&P drawdowns, then the expected convexity is not there (the numerator shrinks). And then combine that with a heavier carry (the denominator shrinks), and the ratio totally collapses vs. the real thing. Accordingly, we’d rather add some additional controlled bleed for the perfect negative correlation.
“Should have. Would have. Could have. Didn’t.” – Gabrielle Zevin
While this is always easy to say in hindsight, in January, implied volatility never really popped like it “should have,” or as it typically does in times of real market stress. In fact, the high closes of the VIX during the month were at approximately the same point as the high closes of December 2021, when the S&P 500 was nicely higher: from December 1, 2021 through the January 27th 2022 (the low S&P 500 close of the month), VIX fell from 31.1 to 30.5, while the S&P 500 also fell by more than 4%!
This disconnect is not only surprising, but a meaningful explanation as to why long volatility was not as outstanding as one might hope during an S&P decline of around 5%. Of further note, with our deeper dive into volatility behavior over recent months, we have assessed an increasingly high intra-day range (high-low) volatility, and to this end, have made, and are making, some innovations in our models that account for this shorter term noisiness.
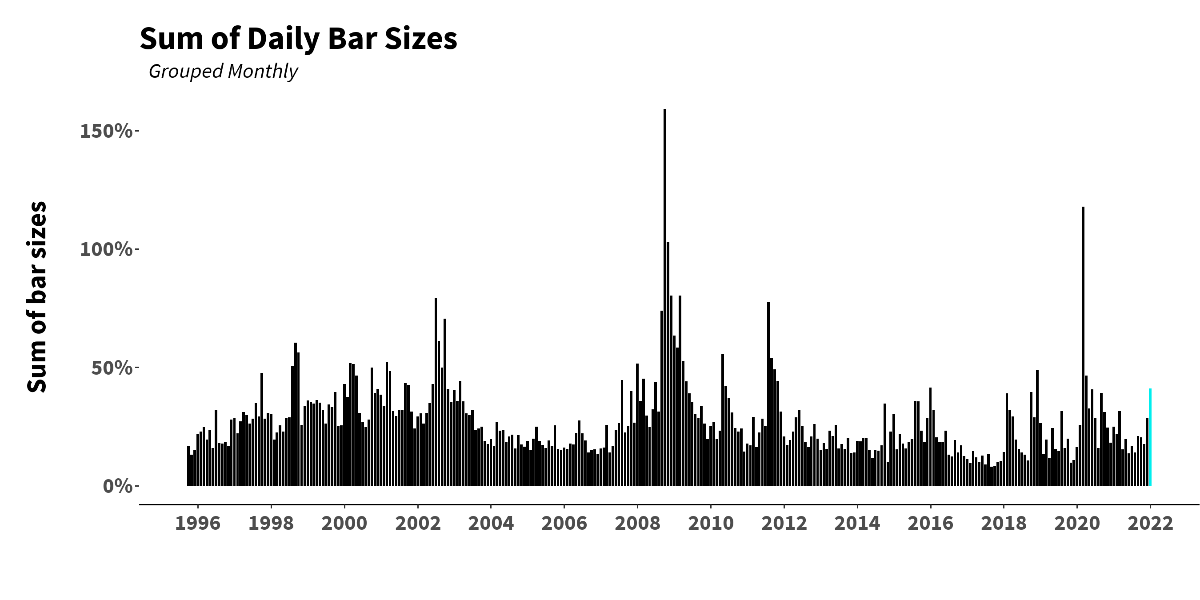
Additionally, in terms of volatility’s disconnected behavior relative to the underlying’s move, there were also some high level differences that are worthy of mentioning. Namely, what we saw in January was a measured grind down rather than a true convexity event. Said in a different way, there was no material “crack” or “falling through the floor” with a big down bar, only a couple of average down days followed by a small recovery day, followed by some continued sideways or mild lower grind. Accordingly, this behavior reflects in Implied Vol movement, where during the 17-trading-day window (Jan 3rd through Jan 27th), the peak-to-trough, close-over-close drawdown in the S&P 500 was -9.80%, while VIX was up +13.9 points.
For comparison to a “true” convexity event, during the most recent large correction (Q1 2020), looking at a similar 17-day window ending March 5th, 2020 (S&P 500 -9.78%, or only 2bps away from the period described above), VIX was +24.6 points – and of course, had another 40 points of upside until its high close on March 16th. While we certainly shouldn’t expect every correction to be accompanied by such an aggressive Implied Vol pop as we saw during the depths of COVID, we see a stark difference in the level of fear and accompanying Vol behavior.
Perhaps this, in hindsight, was actually an indicator of the lack of seriousness of the potential correction – a grinding down move accompanied by a mild increase in implied volatility means, basically, that people were not rushing to buy protection. After all, Implied Vol is wholly determined by market demand across the options complex.
So perhaps January was never quite as dangerous as it may have seemed. To that end, we saw muted performance in January among some comparable hedge fund indices and tail risk strategies:
- HFRX Macro Index: -1.74%
- HFRX Equity Hedge Index: -2.22%
- HFRX Absolute Return Index: -0.87%
- Cambria Tail Risk ETF (TAIL): -0.78%
- CBOE Eurekahedge Tail Risk Hedge Fund Index: -1.76%*
*Comprised of Funds that have reported as of 2/15/2022
“There are no solutions; there are only trade-offs.” – Thomas Sowell
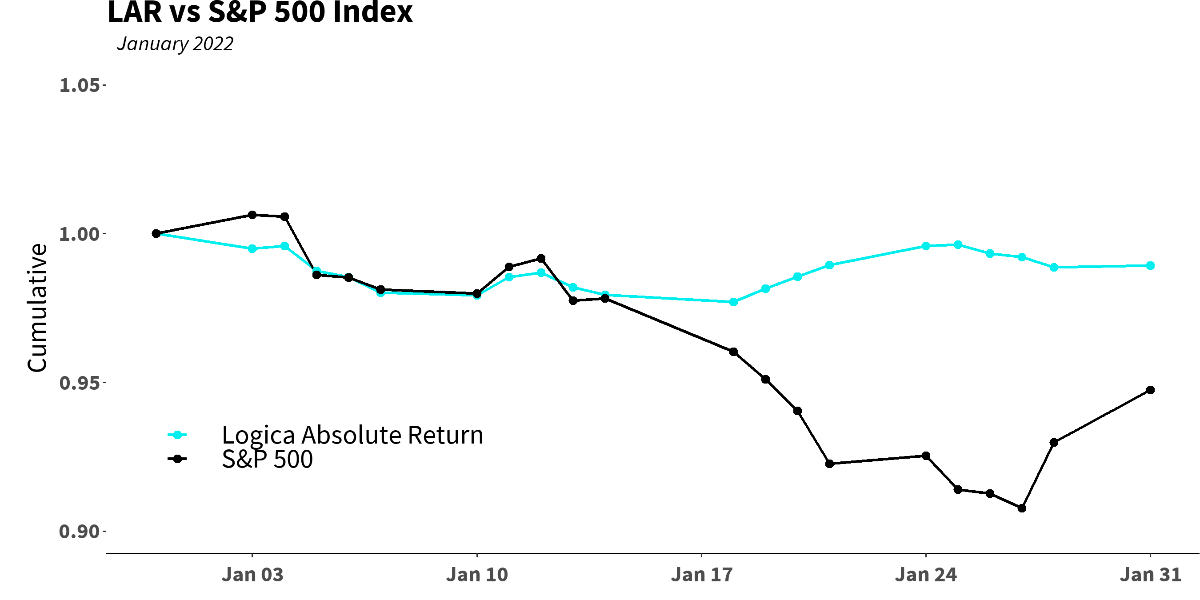
Further, this potential mildness aligns with what our models were showing during the move, as they did not move us into Phase Shift/red flag territory until the middle of the month. This is partly why, as seen below, LAR didn’t quite get past the “straddle valley” and begin participating on the downside until around Jan 19th/20th:
LTR, on the other hand, by virtue of holding half the amount of Calls as LAR, began participating nearly immediately, and certainly in full effect by mid-month (although, still not showing off its full convexity potential due to the S&P 500 rebound, and implied volatility crush toward the end of the month).
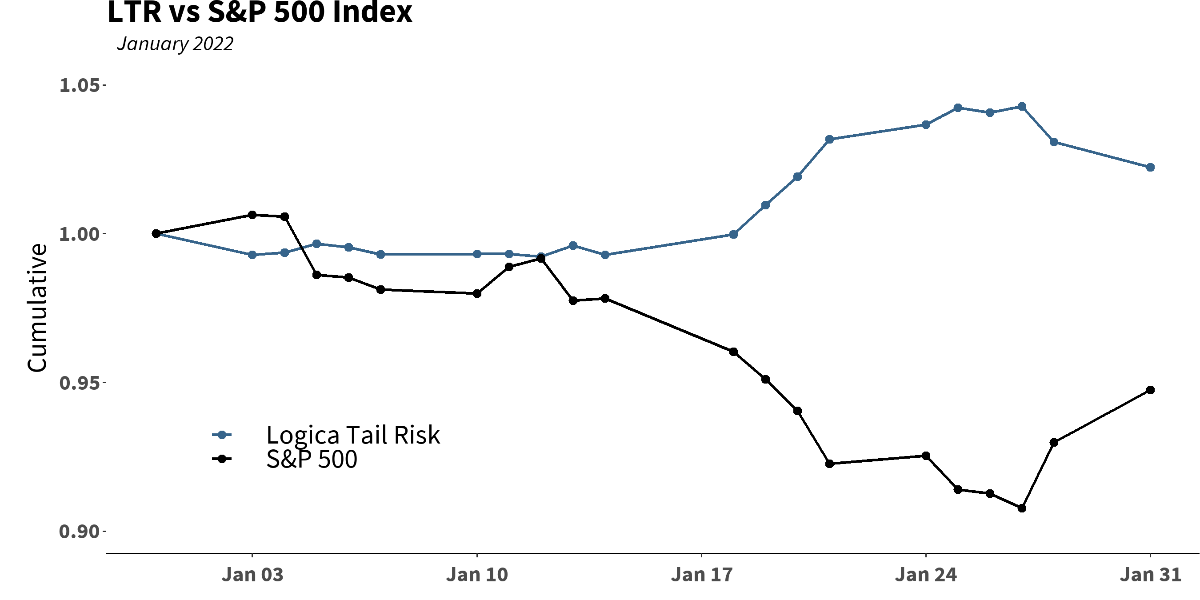
The material point here is to note the trade-off between the two strategies: LAR has a slightly larger valley to overcome before it begins participating (by virtue of holding additional upside Calls that help it do better the rest of the time). LTR, on the other hand, begins participating immediately in nearly every situation, by virtue of at-the-money S&P Puts at double the exposure of Calls vs LAR. In this almost perfect exchange of upcapture vs. downcapture, choosing one’s pain point is what becomes crucial. Sadly, there is no having our cake and eating it too.
Logica Strategy Details
If you would like to learn more about our strategies, please reach out to:hello@logicafunds.com
424-652-9500
Follow Wayne on Twitter @WayneHimelsein
Updated on
Sign up for ValueWalk’s free newsletter here.