

By MarketBeat. Originally published at ValueWalk.
The S&P 500 (ASX:SPY) has been selling off since it peaked at its all-time high of $479.98 on Jan. 3, 2022. Shares fell as low as $410.64 before staging a bounce attempt. Since the pandemic lows of $218.26 set in March 2020, the “buy the dip” strategy has worked out well for the most part. However, there is a key reason it’s no longer working and may not work moving forward, higher interest rates. The U.S. Federal Reserve has been incredibly dovish with its quantitative easing (QE) pumping over $120 billion a month in asset purchases ballooning the balance sheet to nearly $9 trillion. The “easy” money has been a boon to investors, and a bane to savers as interest rates literally non-existent and a bane to consumers as this has allowed inflation to spike to the highest levels in 40-years at 7.5%. This is a far cry from the 2% inflation rate that the Fed has targeted. The question is why has the Fed let inflation rise so high?
Q4 2021 hedge fund letters, conferences and more
Transitory or Sustained?
Due to the COVID-19 pandemic and self-inflicted economic stops from lockdowns, the drop in productivity was expected to be temporary. On the flipside, the snap-back recovery bounce on the reopening was also expected to be temporary as it overshoots. Replace the word temporary with the term transitory and that’s what Fed Chairman Jerome Powell was preaching all through 2021. The inflationary pressures are due to the spike in demand overwhelming the supply shortage as a result of the reopening from the pandemic. It’s all temporary and will revert back to “normal”, right? However, the problem is that shutting down factories and production and then getting them back online is not an easy or cheap task. This is evident by the global chip shortage and supply chain disruptions we’re seeing globally. Food, fuel, and wage inflation has run amok as the U.S. has seen the fastest spike in CPI in four decades. The Fed has changed its rhetoric and eliminated the word “transitory” from its vocabulary. Since unemployment is at record lows under 4%, the “coast is clear” to start monetary tightening gradually.
Monetary Tightening
We have been in a monetary expansion period since the pandemic. Now it’s time to pay the piper (back). This means tapering down the monthly bond purchasing (QE) program and nearly eliminating it in Q1 2022. It also means trimming the massive Fed balance sheet down from nearly $9 trillion. Most impactfully, it means raising interest rates to combat inflationary pressures. The combination of all three drive the monetary tightening process designed to dampen the pace of economic expansion and inflationary pressures. Naturally, this is bearish for asset prices especially stocks. The stock market moves on rumor and resolves on news. The anticipation of rising rates and transition to a hawkish stance was evidenced by the December FOMC meeting minutes. This set-off the stock market cliff dive in early January 2022 as the SPY fell nearly 10% off its highs and Nasdaq fell 20% off its highs by the end of February, before the recent bounce. There is wide speculation that the Fed will raise interest rates from 3 times up to 6 or 7 times as Jamie Dimon of JPMorgan Chase commented on its earnings conference call. The bottom line is higher interest rates mean lower markets as “risk off” stance takes effect. The Russian invasion of Ukraine is causing oil prices to spike and the ensuing sanctions against Russia will impact prices for products in the U.S. and globally. While some speculate that the Fed may ease up on the hawkishness due to the geopolitical events, if the outcome is the acceleration of inflationary pressures, then the Fed will have to react even harder to offset the expectant surge. This year may very well be one of playing defense as the whole market climate has reversed with the Federal Reserve’s stance on interest rates. There will be opportunities for investors and traders who administer discipline and patience over panic and FOMO. Let’s take a look at where the most opportunistic spots will be on the SPY.
S&P 500 Price Trajectories
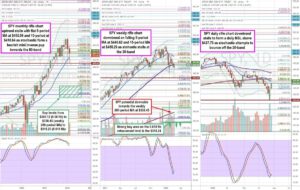
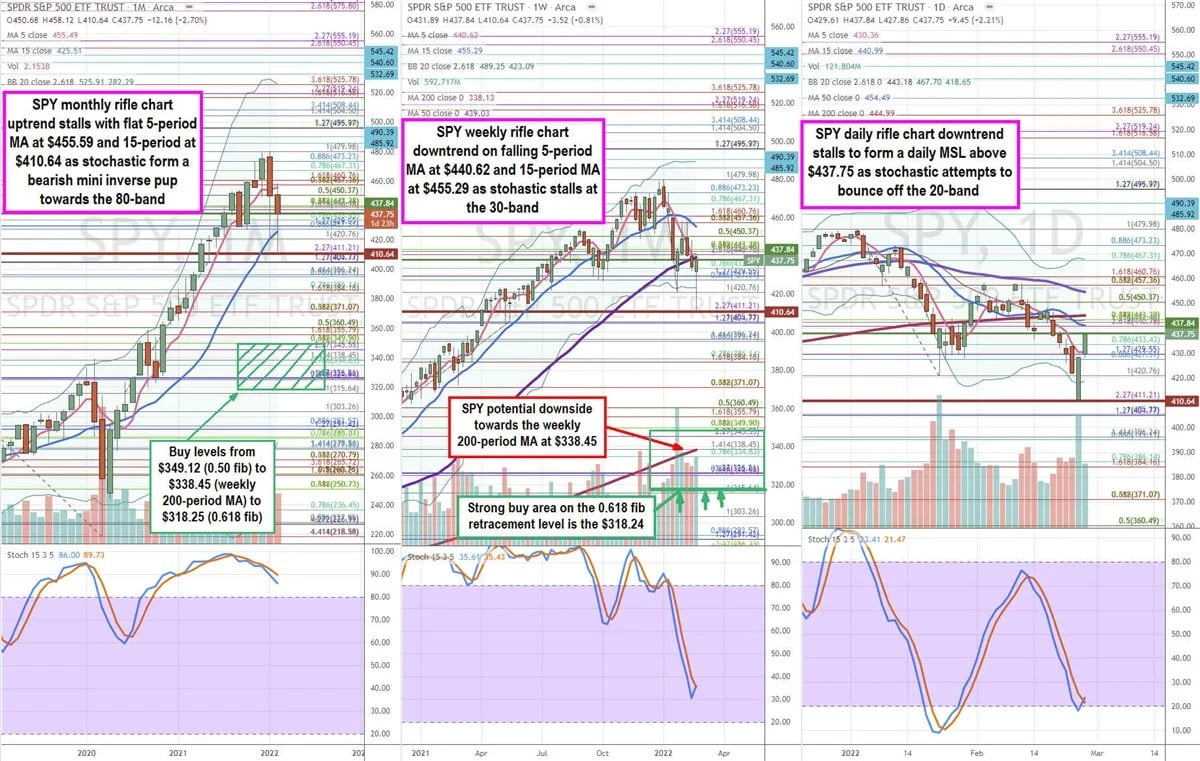
Using the rifle charts on monthly, weekly, and daily time frames provides a bird’s eye view of the SPY. The SPY hit a pandemic low of $218.26 on March 24, 2020, from a high of $337.34 on Feb. 19, 2020. The SPY proceeded to rally off the lows to a high of $479.98 on Jan. 4, 2022. Shares then proceeded to fall to a near-term low of $410.64 before attempting a meaningful rally. Watching key Fibonacci (fib) levels using the pandemic low to the post-pandemic high (net 261.72 points) provides a key 50% retracement level at $349.12 and the 61.8% powerful fib retracement area at $318.24, which is the ultimate buy area for traders and investors. The monthly rifle chart is the widest time frame providing the broadest and arguably the most effective view for long-term investors. For two years the monthly rifle chart breakout uptrend lasted before finally forming a market structure high (MSH) sell trigger on a breakdown below $410.64. The monthly stochastic has stairstep mini inverse pups but is still above the 80-band. If the monthly stochastic falls under the 80-band, look out below as a deeper oscillation could eventually sell-off the market towards the 0.50 and 0.618 fib retracements at $349.12 and $318.24, respectively. This would usher in a bear market. These are both great buy/average levels for investors to consider scaling in long positions. Meanwhile, the weekly rifle chart has been in a full oscillation down falling from the 80-band to the 30-band before attempting to cross up again after the markets bottomed on the Russian invasion of Ukraine. The key resistance of the weekly 50-period moving average (MA) is at $439.03 with the weekly 5-period MA resistance at $440.62. If the weekly stochastic manages to cross up, then a channel tightening back to the weekly 15-period MA is possible at $455.29. However, if the weekly stochastic coil attempt turns in a mini inverse pup, then a further sell-off is possible towards the 0.50 retracement area $349.12 and the powerful weekly 200-period MA at $338.45, which coincidentally happens to be close to the pre-pandemic highs (339.08) made in 2020. The daily rifle chart illustrates the near-term daily market structure low (MSL) buy trigger above the $437.75 based on the strong reversal attempt as stochastic coils off the 20-band. Keep in mind that bear markets have very sharp bounces, but the wider time frames need to be kept in perspective to gauge the general market downtrend. In summary, expect the market to bounce first on the daily MSL triggers but the wider time frame charts of the weekly and especially monthly have to be respected and used to gauge areas to sell into the bounces. The ideal areas to buy is when the SPY falls down to the $349.12 to $218.25 levels, which represents a multitude of supports including the 0.50 fib to the 0.618 fib retracements and the weekly 200-period MA.
Should you invest $1,000 in SPDR S&P 500 ETF Trust right now?
Before you consider SPDR S&P 500 ETF Trust, you’ll want to hear this.
MarketBeat keeps track of Wall Street’s top-rated and best performing research analysts and the stocks they recommend to their clients on a daily basis. MarketBeat has identified the five stocks that top analysts are quietly whispering to their clients to buy now before the broader market catches on… and SPDR S&P 500 ETF Trust wasn’t on the list.
While SPDR S&P 500 ETF Trust currently has a “N/A” rating among analysts, top-rated analysts believe these five stocks are better buys.
Article by Jea Yu, MarketBeat
Updated on
Sign up for ValueWalk’s free newsletter here.