


"I'll never know war
And if I ever know it
The glimpse will be short
Fireball in the sky
No front line battle cries
Can be heard as the button is pushed by a soul that's been bought
And the armies remaining will judge without people or courts
And there's no point pretending that knowing will help us abort
I'll know no war" – The Who
No point in pretending, is there?
Day 12 of the war in Ukraine and you can tell on the weekend shows that Americans are already losing interest. Oil tested $130 early this morning and is still at $121 as Biden is threatening to ban Russian Oil (10% of the World's Oil) and Natural Gas (/NG) has blasted back over $5 for a full 0.50/contract gain since our pick last Monday in the PSW Report (which you will never miss if you subscribe here)., where I said:
Of course we went long on Silver (/SI) again as it tested $24 on Friday – that's easy money and already at $24.40, which is up $2,000 per contract over the weekend. We also took a long on Natural Gas (/NG) at $4.56 and that hasn't moved much yet, so still good for a new trade as it will skyrocket if Putin cuts Europe off.
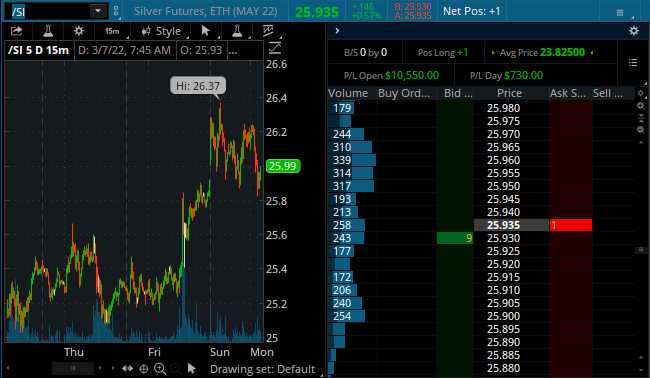 Silver is now at $26 and that's up a whopping $10,550 for the week for our Members at the moment and those Natural Gas contracts are up $5,000 each as well so congratulations to those who do subscribe and were able to play along at home!
There are many ways to skin a cat and knowing how to play the Futures is a very useful tool to have in your belt and it's amazing how you can make these very obvious trades (gold, silver, oil and natural gas rising during a war with Russia, for example) even after the news is released.
In fact, reading the news and keeping up with events is what good fundamental investing is all about. That's why it's called PhilStockWORLD and that's why Warren Buffett says he spends about 80% of his day reading and our Members are well aware I also do my fair share of it – sharing the highlights so our traders can see where I'm getting my crazy ideas from (see also our "Market Moving News" magazine on Flipboard).
You can't just pick up a paper when something happens to "catch up" – it's all part of a grand, interconnected tapestry of events and, if you can understand which thread is being pulled and when – THEN you can more easily see which threads you should be investing in at any given time. See – simple!
"Once amid the soft silver sadness in the sky
There came a man of fortune, a drifter passing by
He wore a torn and tattered cloth around his leathered hide
And a coat of many colors, yellow-green on either sideHe moved with some uncertainty, as if he didn't know
Just what he was there for, or where he ought to go
Once he reached for something golden hanging from a tree
And his hand came down empty" – Carole King
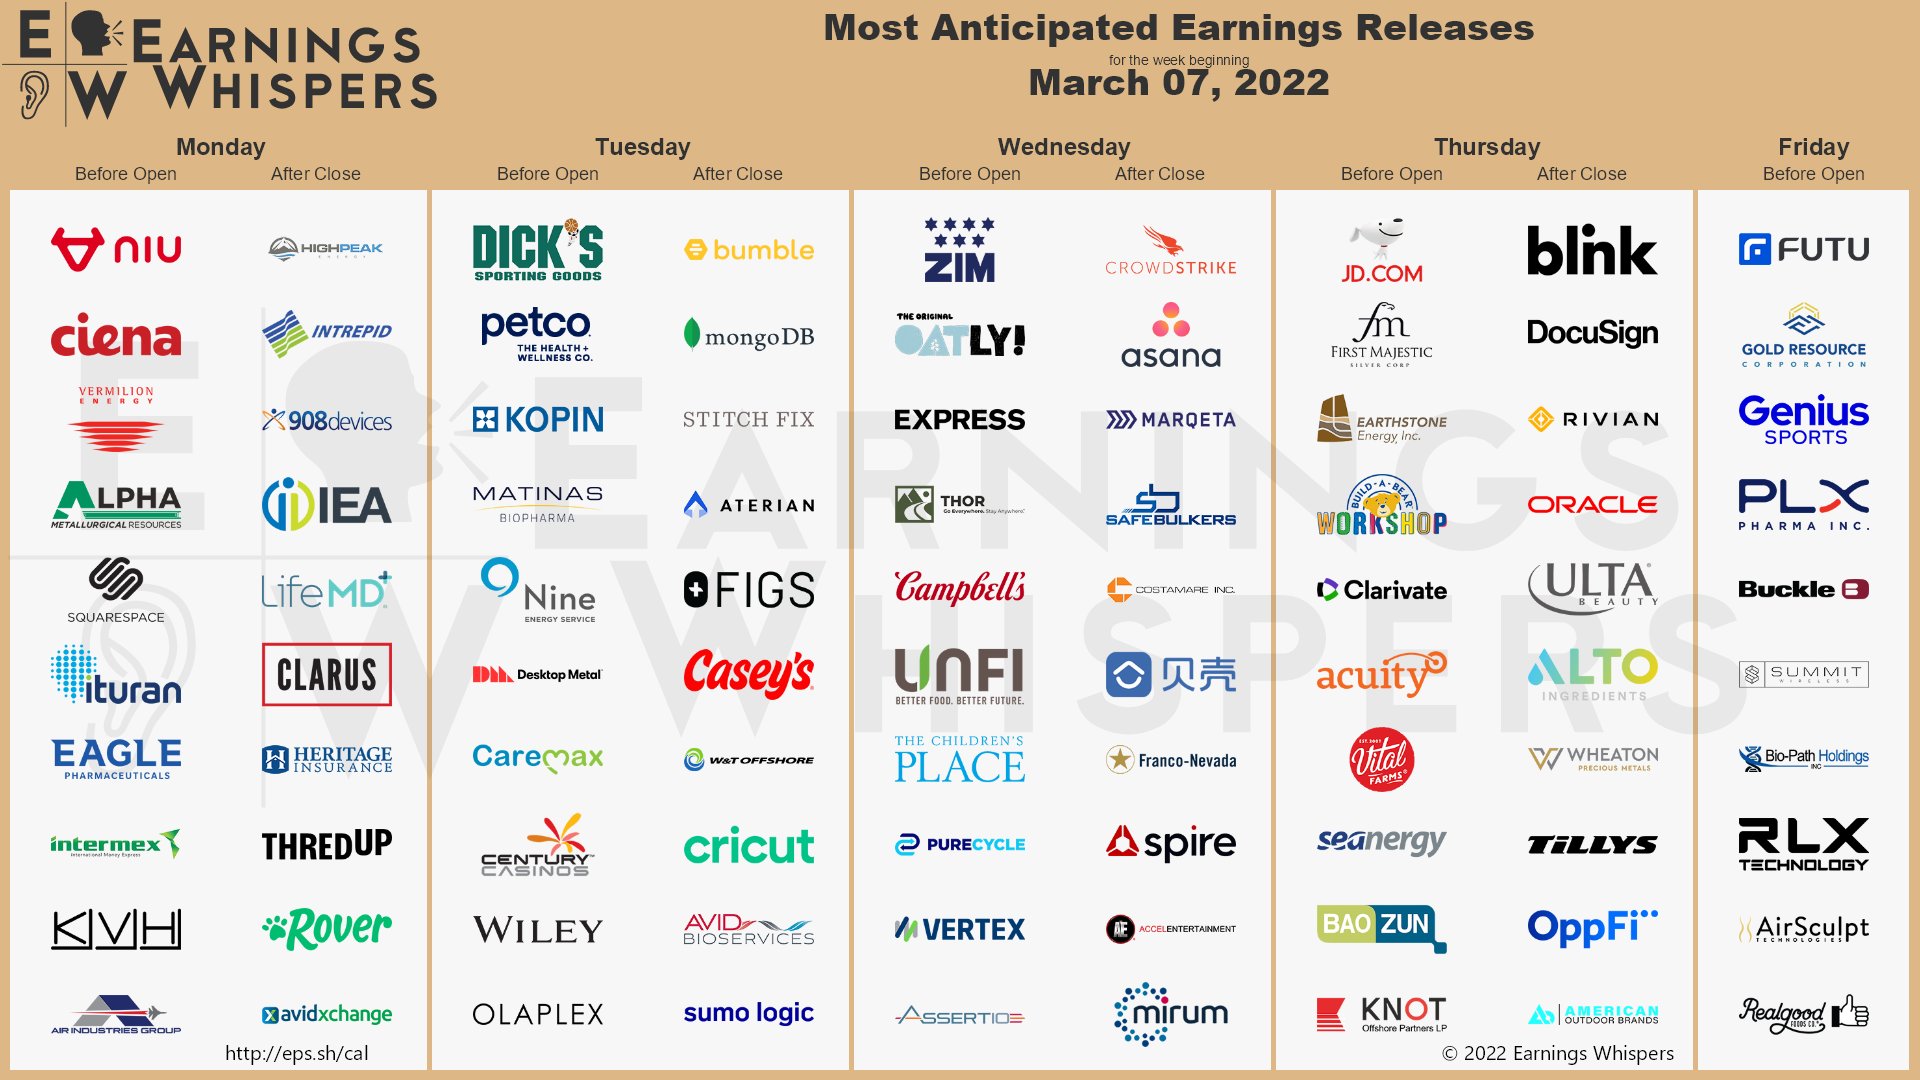
We also pay attention to the Data and we have CPI on Thursday and Consumer Sentiment on Friday but not a whole lot else going on although Earnings are still coming in daily – so let's pay attention to the changes in what the CEOs are saying regarding outlook now that the war is shaping up to be more than a weekend exercise.
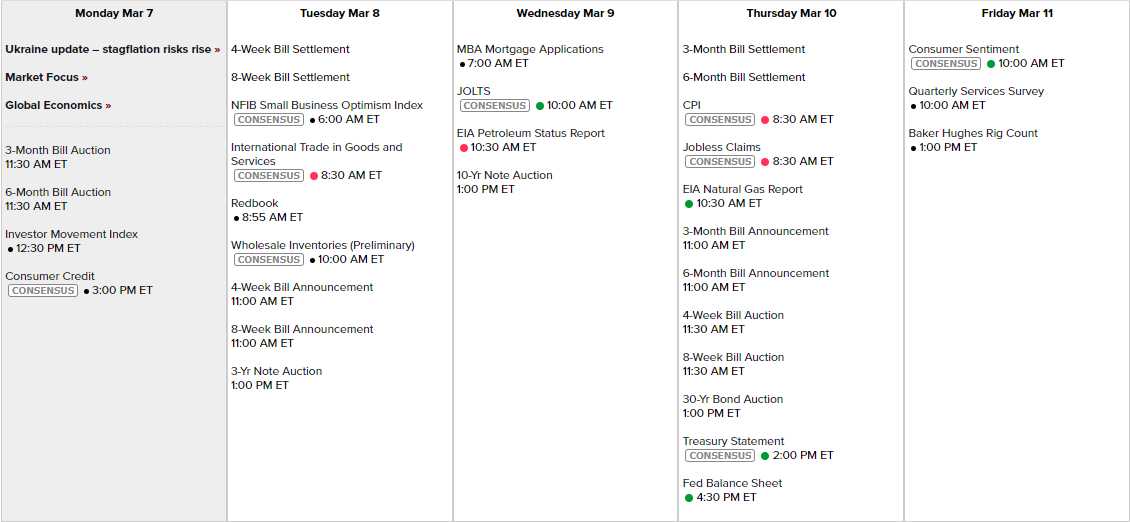
Predominantly small-caps at this point and no Fed Speak as we have the meeting next week and clearly Powell didn't instill any lasting confidence last week so we'll just have to sit back and watch our bounce levels and see how things look but, so far, NOT GOOD:
- Dow 36,000 to 28,800 would be a 7,200-point drop with 1,440 bounces to 30,240 (weak) and 31,680 (strong).
- S&P 4,800 is 20% above 4,000 and that makes it an 800-point drop with 160-point bounces so 4,160 (weak) and 4,320 (strong) is where we are this morning (again).
- Nasdaq is using 13,500 as the base and we bottomed yesterday at 13,580. 14,100 is the weak bounce and 14,700 is strong.
- Russell 1,600, would be about an 800-point drop with 160-point bounces to 1,780 (weak) and 1,960 (strong).
   
|


NONE of these lines should be red as this is the chart that tracks the 20% correction we haven't even had yet (but we predicted in January). We were HOPING it wouldn't come to this but, as our Members well know – Hope is not a valid investing strategy – so we have remained very well-hedged and are mostly just watching this all unfold – waiting for a clear opportunity to come off the sidelines with our CASH!!!
The S&P and the Russell are at their inflection points so any additional red on this chart will indicate we're on a sinking ship – so make sure you know where those lifeboats are….