

By Pierre Raymond. Originally published at ValueWalk.
The Broad Market Index was down 3.27% last week and 50% of stocks out-performed the index.
Another drop in share prices last month (April 2022) with stocks down 9%. Again, it is all about bonds as long-treasury bonds fell 9.7%. It is important to understand that we have still not seen signs of weakness in stocks. More volatility in the stock market is masking the historic drop in the value of bonds. Long treasury bond yields are up to nearly 3% and still an unrewarding T-Bond yield when inflation is 8.5% and rising.
Q1 2022 hedge fund letters, conferences and more
Continuous rising interest rates have depressed the value of all assets. This illustrates the impact on the value of assets when interest rates are rising and growth expectations are down. The value of assets was broadly pushed up by over a decade of money printing and ultra-low interest rates.
The opposite is playing out now and it becomes much more difficult to manage assets in the face of higher inflation and higher interest rates.
Still Stocks Outperform Bonds
The high growth rate of US companies appears as the only return that can compete with inflation. The US corporate growth rate is unusually high and exaggerated by the recovery wave from the virus.
Stocks perform relatively well because some companies grow faster than the inflation rate. With inflation and interest rate rising it is important to own companies with rising growth (see acceleration attributes below: MoneyTree with a tall green tree in a golden pot).
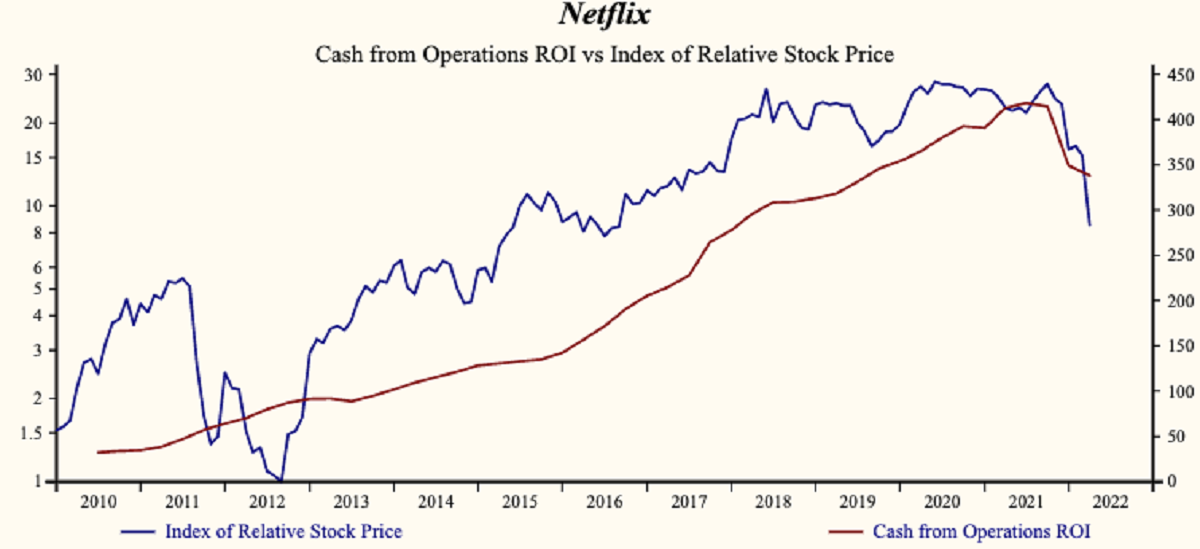
Share prices of high-growth companies have recently shown the steepest decline. As they should with rising interest rates. Despite strong fundamentals, share prices of high and falling growth companies have collapsed. The Consumer Growth Sector index seems resilient for now but the smaller in capital size Russel 2000 Growth stock index continue to be under pressure as they have more difficulty in passing on increasing cost of goods sold. See the Otos MoneyTrees below for their financial stability comparison.
Netflix Previews Market
Last week was also an illustration of the big impact of falling growth and rising interest rates when Netflix, Inc. (NASDAQ:NFLX), already a depressed stock fell an additional 30% when the company announced another slowdown in growth. Netflix ($190.360) is a rich company getting worse.
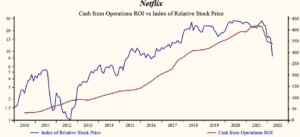
Netflix has been an exceptionally profitable company with persistently high cash return on total capital of 150.7% on average over the past 18 years. Over the long term the shares of Netflix have advanced by 753% relative to the broad market index.
Netflix Growth Factors
The shares of Netflix have been very highly correlated with trends in Growth Factors. The dominant factor in the Growth group is Cash from Operations (ROI) which has been 97% correlated with the share price with a one-quarter lead.
Currently, sales growth is 15.2% which is low in the record of the company and lower than last quarter.
Netflix is recording a high and falling gross profit margin. SG&A expenses are low in the record of the company and rising. That implies that the company has limited scope for further cost containment and rising costs are slowing the EBITD growth rate relative to sales. Lower gross margins and higher SG&A expenses are producing a deceleration in EBITD relative to sales.
More recently, the shares of Netflix have declined by 70% since the June, 2020 high.
The shares are trading at lower-end of the volatility range in a 22-month falling relative share price trend. The already current depressed share price implies that there is likely to be a better future opportunity to sell the shares of this evidently decelerating company.
Market Risk
The risk is similar for the whole market, growth will continue to be in question in the coming quarters and interest rates will rise. Be scrupulous to sustain acceleration attributes as you see your portfolio companies report in coming weeks. It is the only way to compete with rising inflation!
That is, look for a tall green MoneyTree in a golden pot on our website OTOS.io. Sell stocks of companies with falling profit margins. (Sell all your MoneyTrees with a brown globe and a red pot)
SEC Financial Statement Reporting
Last week 300 companies updated their Securities and Exchange Commission financial statements but it is too early to measure the direction of the market average or trend.
Early companies filing in this quarterly period are those with fiscal quarters ended in February. The larger volume of SEC filings will appear later this month with retailors. The next two weeks will see the deluge as companies report their quarterly financial statements ahead of the May 8 deadline.
Do NOT Procrastinate Any Longer!
For decades procrastination paid off as lower interest rates insured that asset values were up (even assets that performed poorly). We are seeing, now in the face of higher interest rates and downward pressure on asset prices, procrastination is a very bad strategy.
It is important to be methodical and take our time when assessing new financial reports. However, it has never been so important to review and compare company fundamentals and their immediate trend.
After the steep decline in prices many growth stocks are trading at depressed share prices. Buy high-sales growth companies with a rising gross profit margin.
How? Otos MoneyTrees
Sell MoneyTrees with red trunks and red pots as they appear in the coming weeks. The more stable the pot appears, the better the attributes. Green and gold are good. Red is bad and the more intense the red the more urgent the call to action.
Otos identifies decelerating companies “Sell MoneyTrees” with a red stem (even high and falling sales growth is a very negative attribute), a brown globe (falling profitability) and a trim red pot (falling profit margins and no operating/financial leverage).
The Components of the Otos MoneyTree Avatar:
CFROI: Cash from operations (ROI) – The Crown of the Otos MoneyTree. Quarterly-trailing-annual-Cash-Flow Return on Investment is a broad measure of the profitability of the company.
Sales Growth: The Trunk of the Otos MoneyTree represents this top-line measure of growth. Otos creates the factor quarterly. Each value is the average of four quarters trailing
Gross Profit Margin: The margin of a business is the relationship of profit to sales. The top rim of the MoneyTree pot displays the gross profit margin. The ratio of sales to variable costs. (“cost of goods sold” on most income statements)
Capital expenditures: The convexity of the pot illustrates cash expended for the purchase and construction of property plant and equipment. It is a measure of investment for the future.
Debt borrowing: The concaveness of the pot measures cash received from all forms of debt. It is a measure of financial condition.
EBITDA Profit margin: The Bottom Rim of the pot of the Otos MoneyTree displays Earnings Before Interest Taxes and Depreciation/Amortization. This factor measures profit after all direct costs, both variable costs (“cost of goods sold” on most income statements) and fixed costs (“selling, general and administrative expenses” on most income statements)
Visit our website OTOS.io and experience your financial reality as FREEDOM AND EMPOWERMENT.


Updated on
Sign up for ValueWalk’s free newsletter here.