

 We're finally here!
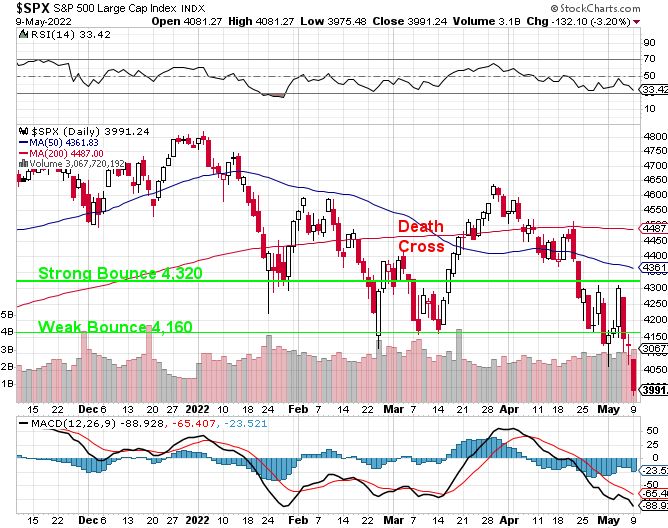
After making the dreaded "Death Cross" way back in mid-March, we have finally hit our goal of S&P 4,000, which is the 20% pullback line we've been expecting since the fall. Now we'll have to see what kind of bounce we get off this bottom but fortunately we are still using the same lines predicted by our flawless 5% Rule™ since we first drew the chart. My note to our Members at the time was:
As we predicted in our Live Trading Webinar last month, we're about to hit that "Death Cross" on the S&P 500 and that is BAD. Even though we could see it from literally a mile (and a month) away, it will still come as a surprise to traders and analysts, who use TA completely wrong on a mass scale. As I said at the time, if you understand HOW a chart is made, then you can predict what it will look like in the future. If you are GUESSING where the market will go based on the chart you see – you're doing it wrong.
Very simply, the 50-day moving average changes slower than the 200-day moving average and "slower" isn't just some vague notion – it does, in FACT, change at a pace that is 25% slower than the 50-day moving average so every day the market closes below the 200-day moving average, it drags the 50-day moving average 4x lower than it does the 200-day. Therefore, we KNOW how many days it will take before we get our crosses long, long in advance.
What does the Future hold? Well we have the Fed Meeting next week and inflation is out of control so it's not at all likely they don't hike at all and the market expects 0.25% and 0.5% would be a big negative – so there's no likely positive there. We also have PPI, Retail Sales, Housing Starts, Industrial Production and the NY and Philly Fed – hard to see any of those things popping us over the 200 dma so, if we assume we have another 7 trading days below the 200 dma – that is likely to pull the 50 dma below 4,450 – where we'll get our cross into Q1 Earnings – which are not going to be very positive either.
Meanwhile, we watch and wait for the market to resolve itself but that looming Death Cross means it's not likely we'll be jumping off the sidelines in the next two weeks. We went over our hedges yesterday and they seem adequate but I do keep thinking I'd rather be in CASH!!!
 Notice instead the S&P popped off that Fed meeting, where they did a 0.25 hike but that rally didn't last long and, fortunately, we took that opportunity to get more aggressive with our hedges, while they were cheap to acquire. We had a two-week head-fake but fortunately we realized the Fundamentals hadn't changed so we remained cautious and, at the end of March, things had started to collapse and now here we are in May – still looking for a bottom.
As you can see from this S&P 500 monthly chart, we did not build much of a base at 4,000 on the way up – so it's not going to provide much support on the way down if sentiment doesn't improve. 800 points (20%) below here, we have very nice support at 3,200 and 2,400 is fantasic support, but that's 60% off the top so, hopefully, we don't see that again. Keep in mind though that we've seen plenty of big stocks drop 60% recently – so it's not out of the questiion.
A 60% drop, back to 2,400 would take us back to our pre-Covid/pre-Stimulus lows or "back to normal". Still, I think the case can be made that all the liquidity (seen via inflation) the Fed dropped into the economy ($11Tn with Congress, which is 50% of our GDP) is not going to simply go away – so Old Economy + 20% doesn't seem so crazy – and that brings us back to 3,200 as a likely base. Unfortunately, that makes 4,000 more likely a top than a middle and that means it's more likely we're going to have only a weak bounce (4,160 on /ES) and then move back into a range more likely around 3,600 to 4,000 until next quarter.
We're back to 73,000 people a day catching Covid, that's on track for another 8% of the country (26M people) catching it this year but you know what happens with that pesky virus when 1 out of 12 of us is infected, right? Look around you – if you see 12 people – you may have a problem! I'm keenly aware of that as I'm in Las Vegas, where very few people are wearing masks and those people are everywhere! Not only that but they all get together and watch shows and touch each others cards and chips, ect – seems like a recipe for disaster.
Cases in Nevada are, in fact, up 83% in May and more than double the +49% rate nationwide. If Nevada is an experiment in opening back up – it's not going all that well… What should concern us most is that's the spread WITH 80% of the people having been vaccinated although that is the number of people who've had just one shot – only 2/3 of us are fully vaccinated. Still, that's 200M more people vaccinated than last May so, HOPEFULLY, it will be enough for us to go out to concerts and movies and clubs this summer without turning into another disaster this fall. We are certainly rolling those dice.
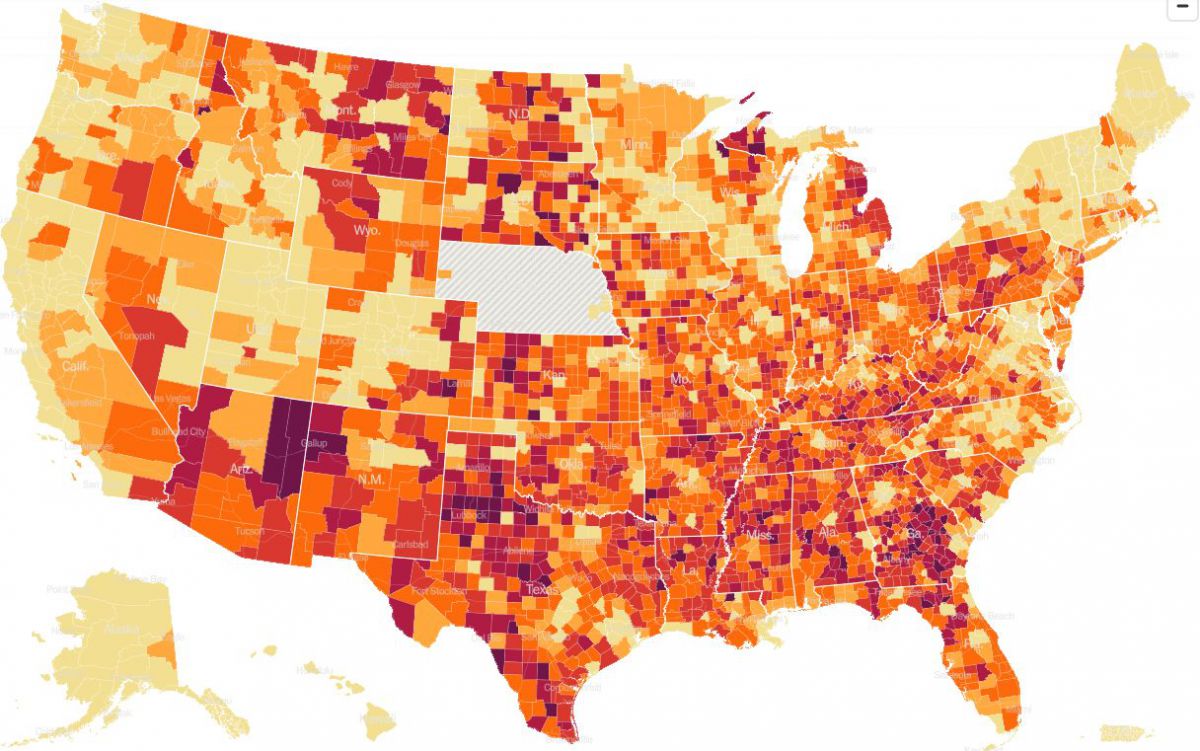
This map shows us places in our country where the most people have had Covid. The darkest red spots tend to have 1/3 of the population catching Covid and 1/100 people dying of Covid while orange (where I live in Florida) is around 1/5 of the population catching Covid and 1/300 dying from it. Light yellow, in those liberal nanny states, has roughly 1/6 catching Covid and 1/600 dying and no, Nebraska isn't really good at fighting Covid – the just don't report their statistics.
So you can see how we got to 1M dead in America (so far) and you can see where the bodies are piling up. As we saw in a recent Gallup Poll however, only 4% of the people think Covid is a major problem – so problem solved, I guess….