
 It’s a big data day today but that’s it for the week.
We’ll get a nice glimpse of how Q4 went for the Retailers and we’ll also see how the manufacturers are faring but then it’s back to earnings, where we’ll hear from each Company and their CEOs one by one.
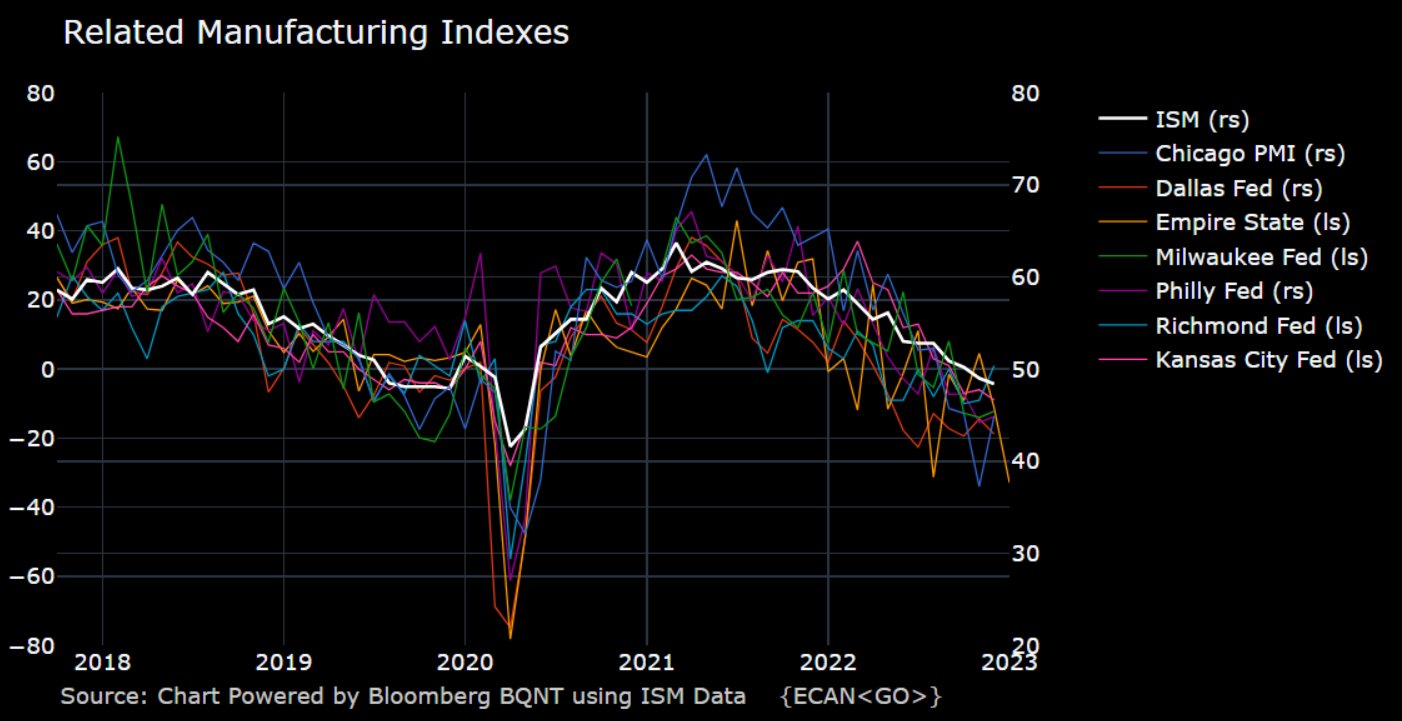
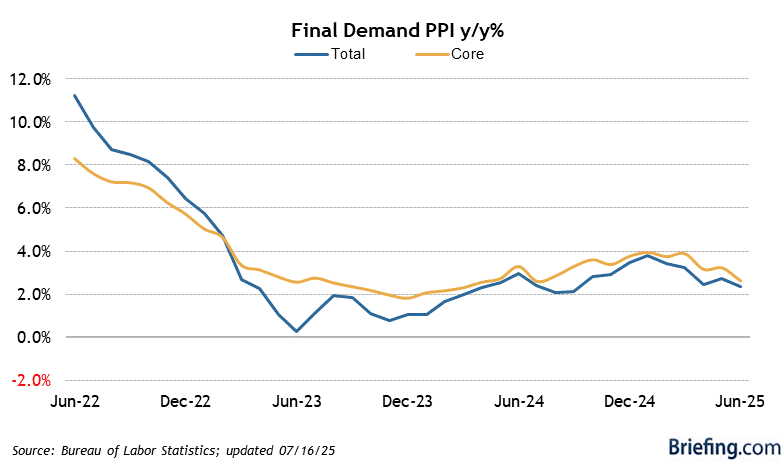
We got a disastrous Empire State Manufacturing Report yesterday morning and, as you can see from the chart above, they are all going to Hell in a hand-basket. And now we’re only two weeks away from the next Fed decision, which I would think would be more like 0.25 as the Economy is going off a cliff – so let’s hope the PPI has calmed down as much as the CPI indicated last week.
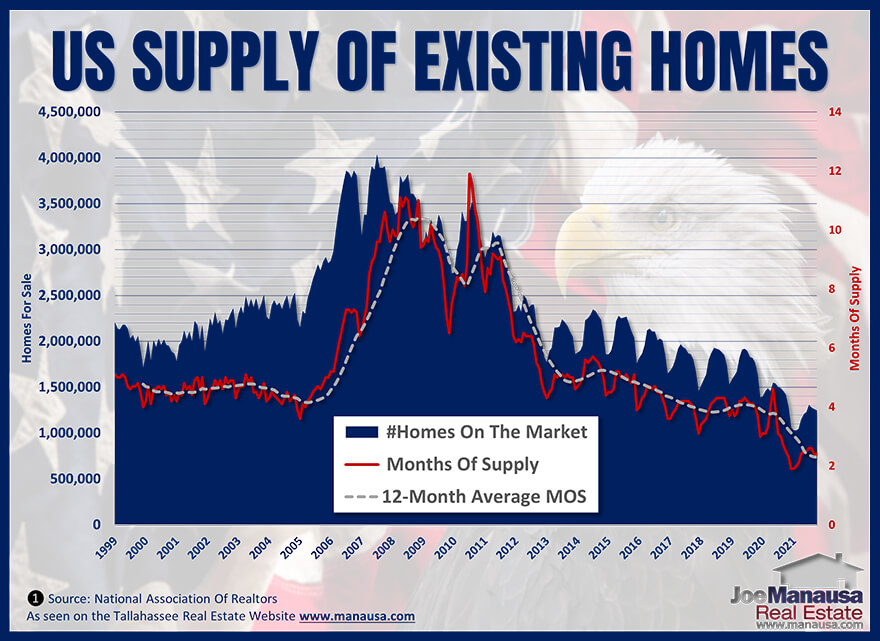
That’s a lot of misses. Yes, it’s early but generally we shoot for 70% beats, not 70% misses – we can’t afford to remain on this trend! Speaking of trends – I can’t believe the conversations I have to have with people explaining what’s wrong with the economy but here it is in one simple chart:

Any questions? And that’s only up to 2020, median (half below, half above) housing prices have leaped to $454,900 as of Q3 while the Median Household Income remains under $90,000, still losing ground. When our parents bought homes in the 60s, 70s and even the 80s, it took 2-3 years’ of average income to purchase an average home. Now it takes 5-6 years’ worth of family income.
The same has happened to Health Care and College costs and the Fed never did anything to keep those things under control – only when labor costs begin to become expensive for our Corporate Masters does the Fed step in and declare an emergency that requires their intervention.
 Since the 2000 crash, the Fed has propped up Home Prices and College costs by offering cheap loans so you, the consumer, can pay off outrageously priced properties and educations on long-term layaways. Health Insurance is a layaway for your medical bills too – only you pay that whether you need it or not – it’s hardly a choice.
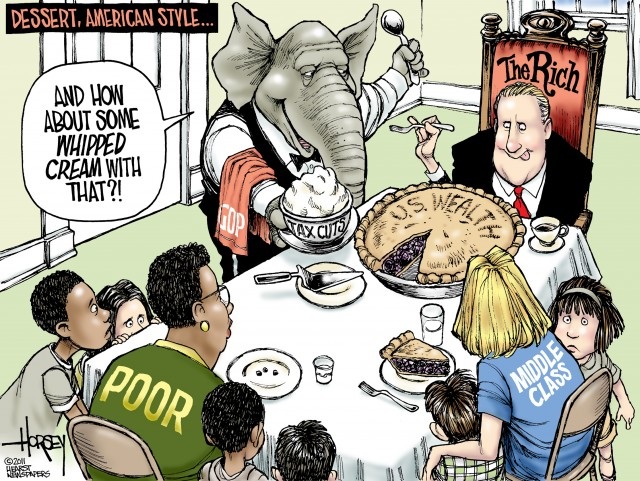
That’s why, even during the pandemic, the Rich got $26Tn richer, with the Top 1% capturing 63% of all the new wealth in the World which was, by the way, generated via $50Tn of Global Stimulus Spending that YOU will have to pay back at some point.
Let’s make that super-clear: 1% of the World is 80M people and they got $26Tn or $325,000 each while the bottom 99% is 7,920,000,000 and they got $16Tn or $2,020 each over the past two years.
Since the Top 1% households BEGIN at an income of $570,000 per year, you can imagine they aren’t too worried about paying the same Health Care and College Costs that you are and you can imagine their mortgage, heating, electric, phone and cable bills aren’t keeping them up at night either so, when you give them an extra $325,000 – what are they going to buy with it?
 That’s right: MORE HOUSES!
They scoop up the supply of existing homes which they then only occupy for a fraction of the time (they have more than one) or they turn around and rent them to you when you can’t find a home in your price range. They also raise the rents because, for some reason, lots of people need to rent homes all of a sudden – driving demand up.
So what does the Fed fix by raising rates? They make it more expensive for those of you in the Bottom 99% (and let’s not kid ourselves, the bottom 50% can’t even afford a home) to pay for a home, which only serves to eliminate the competition for the homes the Top 1% want to buy while they simply switch to paying CASH!!!
There are only 110M homes in the entire US and 80M people were just handed $325,000 – THAT is why home prices are up almost 50% in the last two years. That is why you can’t touch a property in a desirable location like a beach – because there’s a very limited number of those and WAY too many people who can afford them.
This is not going to get better for a long, long time. If we are to assume 2M homes is a healthy supply (going back 25 years) and we only have 1M available homes, there are 1.3M homes built each year and that’s just to maintain the current total (most homes don’t last 100 years) so we’d have to build 25% more homes (325,000) per year for 3 years just to catch up.
But, if we do that, Labor, Lumber and other material prices would go through the roof – and that will make home prices even more expensive. If we don’t do that, rents will get so expensive no one in the Bottom 90% will ever be able to save up to buy one and we’ll end up spending more and more money trying to prop up the aging homes we already have.
 8:30 Update: PPI came in much lower than expected at -0.5% vs -0.2% expected though core PPI was up 0.1% – in-line with expectations. While this is certainly an improvement, keep in mind oil had come down a lot in December and now it’s on the way back up – the Fed knows this – even if traders don’t.
July was also -0.4% when Oil dipped and then we were back to 0% in Aug and 0.3% in Sept, Oct and November, when the Fed felt they had to tighten more and more and more. I’m not sure if the Fed is going to let one data-point change their minds – but the indexes seem happy this morning.
On the whole, we are still waiting for those Earnings Reports to come in before making any major decisions. JBHT and SCHW have also now missed this morning while PLD had a small beat. Later today we hear from AA, DFS, FUL, KMI, TCBI and WTFC.


