

And no, it’s not TA, it’s just good old Fundamental Analysis and our 5% Rule™, which is not TA, it’s just math. There simply wasn’t enough value in the Nasdaq 100 nor was there enough likelihood than any of the upcoming components would push us over the very strong resistance line of 12,000, which is the Strong Bounce line on the fall we’ve had from 15,000 (the rest was an overshoot we predicted as such).
This is why our Short-Term Portfolio is up 1,824% (18x) since 10/28/20 (when we started with $200,000) – it’s a lot easier to make money when you know what is likely to happen next. By simply not believing in TA Voodoo, we are able to make much more rational short-term and long-term bets along the way.
The chart we had yesterday was our Nasdaq WEEKLY chart and we’ve been using it since the 2020 crash to tell us where the range would be on the Nasdaq 100. I know it’s confusing but TA is part of our Fundamental Analysis – simply because so many people follow it, we have to take it into account. If I were studying college students, I would tell you that they tend to drink more, take more drugs and have more sex on weekends and I could chart it, but that doesn’t mean TA is real – it means Fundamentals can be charted – and that’s not the same thing at all.
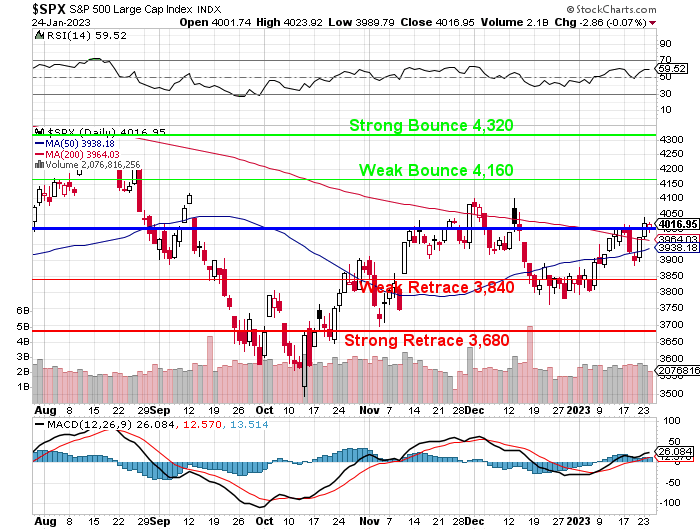
This is our much more volatile S&P 500 Daily Chart and those are the same lines we’ve been using since the 2020 dip as well. They predicted the rally and, as with the Nasdaq – we didn’t change the value lines just because the S&P went up to 4,800 – we just treated it as oversold and enjoyed the ride while it lasted.
We never changed the lines because the VALUE never changed and, eventually, value does get reflected in the price – eventually. Overall, we’re expecting a flat to down year for the S&P 500 and the only reason these lines will change is if the earnings of the S&P 500 change enough to move our range – that hasn’t happened in 3 years.
 If you know your proper trading range for the index, it’s like know where the banks of a river are. The river may wind up and down and it may sometimes get flooded (more liquidity) or it may sometimes get dry but knowing where the banks are SUPPOSED to be means we can more accurately predict what will happen to each individual leaf that’s floating in that river. Though the individual leaves are hard to predict – the overall flow is not, right?
In this case, we’re watching the individual leaves (earnings) and they will give us a sense of which way the current is flowing on the river (our long-term ranges) but, as I noted, there’s going to have to be a lot of evidence before we change our mind about where the banks are. That has come from some very long-term observations we’ve made.
Earnings have gotten off to a rough start with the Financials last week and we were at about 50% beats and this week we’ve moved up to 66% but anything under 70% is BAD and some people, like MSFT last night and KMB & T this morning, are beating but guiding lower.


