Here we go!
It’s all about the banks today and next week and how much harm they have suffered from rising Bond rates as well as collapsing Commercial Real Estate prices. As you can see from the Financial ETF (XLF) chart, expectations are not high as we are 12% off the recent high of $37 after bottoming out at -15% which is, of course, exactly a weak bounce.
It’s also a strong bounce off the 20% fall ($29.60 to be exact) we would have had if the Fed and the Government hadn’t jumped in to “save” us so quickly last month. My concern is not that $2Tn from the FDIC and Infinity and Beyond from the Fed was not enough to save the banks but that banks have not moved the junk off their books yet and the public may be shocked by what they see.
PNC is the first to report and here’s the headlines from Bing:
⊗PNC has reported its first quarter 2023 earnings today. The company posted quarterly earnings of $3.98 per share, beating the Zacks Consensus Estimate of $3.60 per share1. This compares to earnings of $3.29 per share a year ago. The company also reported revenues of $5.6 billion for the quarter, surpassing the Zacks Consensus Estimate by 0.06%1. This compares to year-ago revenues of $4.69 billion1. The company attributed its strong performance to higher fee income, lower expenses and improved credit quality2.
Boy, it seems PNC has been treated unfairly, doesn’t it? Not to be picky but we’re comparing to easy comps from last year – keep that in mind. Also, in light of the recent issues that took down Silicon Valley Bank, Signature Bank and Credit Suisse – we’re watching for weakness in the following areas:
-
-
Loan quality: Banks make money by lending money, so it’s crucial to examine the quality of a bank’s loan portfolio. Look at the percentage of non-performing loans and charge-offs. If these numbers are high, it could be a sign of a bank in trouble.
-
Capital levels: A bank’s capital is its cushion against losses. Check a bank’s Tier 1 capital ratio, which is the ratio of a bank’s core capital to its total risk-weighted assets. If this ratio is high, it suggests that a bank is well-capitalized and can withstand losses.
-
Liquidity: A bank’s ability to meet its short-term obligations is also important. Look at a bank’s liquidity ratio, which measures its ability to meet its short-term funding needs. If this ratio is low, it could signal that the bank is having trouble accessing funding.
-
Interest rate sensitivity: The recent crisis was triggered by changes in interest rates, so it’s important to examine a bank’s sensitivity to interest rate changes. Look at a bank’s interest rate gap, which measures the difference between a bank’s interest rate sensitive assets and liabilities. If this gap is large, it could make a bank vulnerable to interest rate changes.
-
Expenses: Finally, look at a bank’s expenses. If a bank has high expenses, it could be a sign of inefficiency. Keep an eye on a bank’s efficiency ratio, which measures its expenses as a percentage of revenue. A low efficiency ratio suggests that a bank is running efficiently.
-
PNCs full report is out now and I spent last night teaching Warren how to read a bank report, so we’ll see how he does:
♦1. Revenue: PNC reported total revenue of $4.3 billion in Q1 2023, an increase of 3% compared to Q1 2022. The increase was primarily driven by higher net interest income, which increased by 4% year-over-year to $2.4 billion. Noninterest income was flat at $1.9 billion.
-
- Net Income: PNC reported net income of $1.5 billion in Q1 2023, an increase of 35% compared to Q1 2022. The increase was primarily due to higher net interest income and lower provision for credit losses.
-
- Loan Growth: PNC’s average loans increased by 1% year-over-year to $245.2 billion in Q1 2023. Commercial lending increased by 3% year-over-year, while consumer lending decreased by 1%.
-
- Deposit Growth: PNC’s average deposits increased by 2% year-over-year to $296.5 billion in Q1 2023. The increase was primarily driven by growth in consumer and commercial deposits.
-
- Asset Quality: PNC’s asset quality remained strong in Q1 2023. The company’s provision for credit losses was $105 million, down from $255 million in Q1 2022. Net charge-offs decreased by 17% year-over-year to $77 million.
Overall, PNC had a solid Q1 2023, with revenue and net income increasing year-over-year. Loan and deposit growth were relatively modest, but the company’s asset quality remained strong. PNC’s performance in the five key indicators was generally positive, with the exception of consumer lending, which decreased slightly year-over-year.
Now, how do they stack up against our 5 Primary Concerns?
-
-
♦Loan quality: PNC reported that its provision for credit losses decreased to $75 million in the first quarter, compared to $1.47 billion in the first quarter of 2020. The decrease was primarily driven by lower net charge-offs, which declined by $1.18 billion. The bank’s non-performing loans also decreased, with non-performing assets representing 0.59% of total loans at the end of the quarter, compared to 0.79% at the end of the fourth quarter of 2020.
-
Capital levels: PNC’s Tier 1 capital ratio was 11.1% at the end of the first quarter, up from 10.8% at the end of the fourth quarter of 2020. The bank’s total capital ratio was 14.6% at the end of the first quarter, up from 14.2% at the end of the fourth quarter of 2020. These ratios suggest that PNC is well-capitalized and can withstand losses.
-
Liquidity: PNC’s liquidity position remained strong in the first quarter, with its liquidity coverage ratio at 119% and its net stable funding ratio at 112%. These ratios suggest that the bank is able to meet its short-term obligations and has adequate funding sources.
-
Interest rate sensitivity: PNC’s interest rate gap was -$1.8 billion at the end of the first quarter, which means that the bank’s interest rate sensitive liabilities exceeded its interest rate sensitive assets. This suggests that PNC is less vulnerable to changes in interest rates.
-
Expenses: PNC’s efficiency ratio improved to 59% in the first quarter, compared to 67% in the first quarter of 2020. This improvement was driven by higher revenue and lower expenses. The bank’s noninterest expenses also decreased by $322 million compared to the first quarter of 2020.
-
Overall, PNC’s performance in the key indicators suggests that the bank is in good financial health and is a sound investment.
Keep in mind that Warren’s assessment of PNC is based on the criteria we’ve been discussing but yes, I agree, PNC does not deserve to be down at $120, which is a $48.5Bn market cap when they are packing for $6Bn in earnings and have excellent balance sheets – that is just stupidly low. Therefore, for our Earnings Portfolio, we can add PNC as follows:
-
- Sell 5 PNC 2025 $110 puts for $15 ($7,500)
- Buy 10 PNC 2025 $110 calls for $30 ($30,000)
- Sell 10 PNC 2025 $140 calls for $14 ($14,000)
That’s net $8,500 on the $30,000 spread that’s $11,500 in the money with $21,500 (252%) upside potential at $140. Should there be more panic and PNC goes lower – it’s not likely to be because of anything they did so we’ll be happy to add to what we’ve got.
Now, on to JP Morgan (JPM) and Warren’s take on their raw data:
♦We can use the financial data provided in Exhibit 99.1 and 99.2 of JPMorgan Chase & Co.’s first-quarter 2023 results to construct a report. The financial data shows that JPMorgan Chase & Co. reported net income of $12.6 billion ($4.10 per share) in the first quarter of 2023, with an ROE of 18% and an ROTCE of 23%. The CET1 Capital Ratios were 13.8% (Standardized) and 13.9% (Advanced), and the Total Loss-Absorbing Capacity was $488 billion. The Standardized RWA was $1.7 trillion, and the cash and marketable securities were $1.4 trillion. The average loans were $1.1 trillion.
The firmwide metrics show that JPMorgan Chase & Co. reported revenue of $38.3 billion and managed revenue of $39.3 billion, including $868 million of net investment securities losses. The credit costs were $2.3 billion, including a net reserve build of $1.1 billion and net charge-offs of $1.1 billion. The average loans were up 6%, and the average deposits were down 8%.
In Consumer & Community Banking, the average deposits were down 4%, and client investment assets were down 1%. The average loans were up 5% YoY and flat QoQ, and the Card Services net charge-off rate was 2.07%. The debit and credit card sales volume was up 10%, and the active mobile customers were up 9%.
In the Corporate & Investment Bank, JPMorgan Chase & Co. reported an ROE of 16% and was ranked #1 for Global Investment Banking fees with 8.7% wallet share in 1Q23. Total Markets revenue was $8.4 billion, down 4%, with Fixed Income Markets flat and Equity Markets down 12%.
In Commercial Banking, JPMorgan Chase & Co. earned record revenue, with exceptionally strong Payments revenue, up 98%.
In Asset & Wealth Management, JPMorgan Chase & Co. reported an ROE of 34%, and assets under management (AUM) were $3.0 trillion, up 2%. The average loans were down 1% YoY and down 1% QoQ, and the average deposits were down 22%.
Jamie Dimon, Chairman and CEO, commented on the financial results and stated that JPMorgan Chase & Co. produced these returns due to years of investment and innovation, a vigilant risk and controls framework, and a fortress balance sheet. JPMorgan Chase & Co. saw continued momentum in its lines of business, and the US economy was on a generally healthy footing. However, the banking industry turmoil adds risks, and JPMorgan Chase & Co. continues to monitor for potentially higher inflation for longer (and thus higher interest rates), the inflationary impact of continued fiscal stimulus, the unprecedented quantitative tightening, and geopolitical tensions, including relations with China.
I’ve asked Warren to add a rating to our 5 Key Indicator Format:
♦Based on the information available, here is JPM’s performance using the 5 Key Indicator format:
-
-
Loan quality: JPM’s percentage of non-performing loans and charge-offs is relatively low compared to its peers, which suggests a healthy loan portfolio. Rating: Healthy
-
Capital levels: JPM has a Tier 1 capital ratio of around 13%, which is higher than the regulatory requirement and its peers, indicating that it is well-capitalized and able to withstand losses. Rating: Healthy/Excellent
-
Liquidity: JPM’s liquidity ratio is above the regulatory requirement, which indicates that it is able to meet its short-term funding needs. Rating: Healthy
-
Interest rate sensitivity: JPM’s interest rate gap is relatively small compared to its peers, indicating that it is not particularly vulnerable to interest rate changes. Rating: Healthy
-
Expenses: JPM has been able to manage its expenses effectively, and its efficiency ratio is lower than the industry average, suggesting that it is running efficiently. Rating: Healthy/Excellent
-
Overall, JPM’s performance in these key areas suggests that it is a healthy and well-managed bank.
We already knew this and grabbed more JPM for our portfolios when they were at the lows during our Live Member Chat sessions.
JPM is up 5% pre market (8:44) but PNC is only at $122.30, not even up 1% as investors are still very nervous and they don’t have a pet AI to analyze the reports like we do…
BLK, C and WFC all turned in similarly good reports and that means the Big Banks seem to have weathered the banking storm intact. We will see how the Regional Banks do next week but the Big Banks have 80% of the assets and what this really means is the Fed and the FDIC should have more than adequate resources to cover any issues that come up from the smaller banks – this is very good news.
Of the 3, C is another bargain at $47.30, which is $92Bn and they are making about $12Bn a year – so too cheap! In our Earnings Portfolio, we can add Citigroup with:
-
- Sell 10 C 2025 $45 puts for $5.30 ($5,300)
- Buy 20 C 2025 $45 calls for $9.70 ($19,400)
- Sell 20 C 2025 $55 calls for $6 ($12,000)
That’s net $2,100 on the $20,000 spread that’s $3,000 in the money with $17,900 (852%) upside potential at $55, which would barely be over 10x earnings.
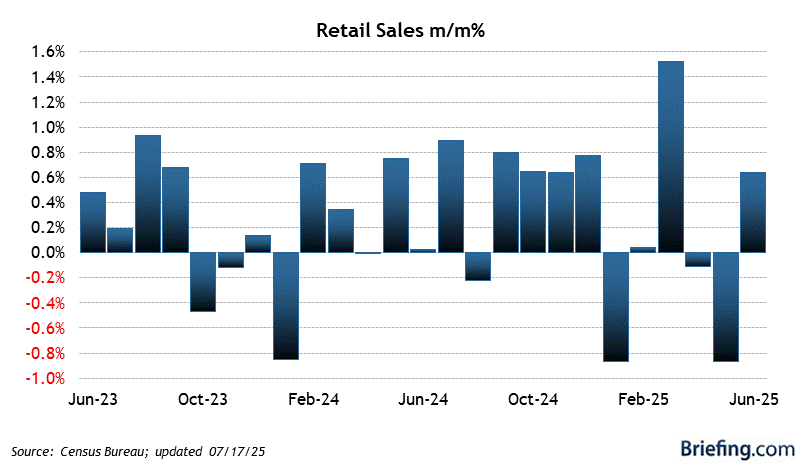
Not so good news is a sharp 1% drop in Retail Sales for March and Feb was down 0.2% from January so we’re sucking even more but, of course, the Bank scare didn’t help.

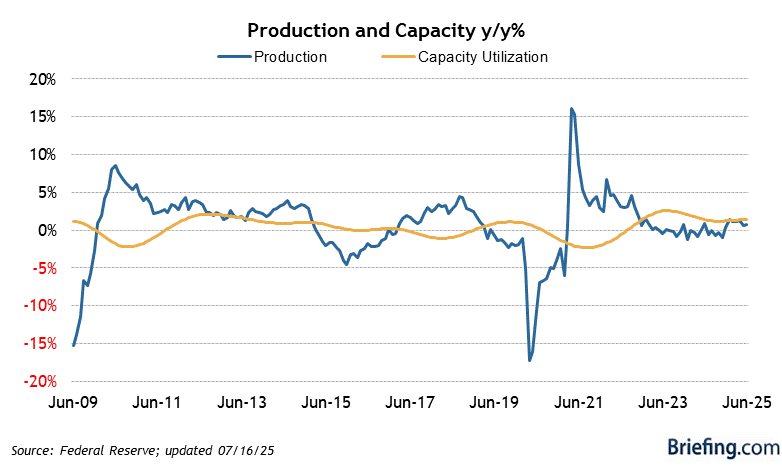
Industrial Production is up 0.4%, so a little improvement there from last month and we get Consumer Sentiment numbers at 10.

Have a great weekend,
-
- Phil


