
Here we go again.
Powell was vague enough yesterday that the MSM Spin Doctors have convinced Retail Traders that the Fed is done (again) with rate hikes and now we can party like it’s 1999. Most of what you read in the Financial Media is propaganda, not real news – that’s why Billionaires keep buying media outlets and why all the sponsors are Banksters and Brokers – all of whom have a vested interest in keeping people interested in buying stocks.
The reality of the situation is too complex to explain in a sound bite and sound bites are all the public has been trained to absorb these days. The reason all these Fed hikes aren’t hitting the consumers yet is because a significant portion of US Consumer Debt still carries fixed interest rates set before the Fed started hiking in 2022.
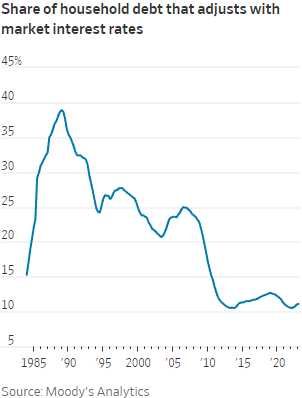 Many individuals and households locked in ultralow rates on debts such as mortgages and auto loans during the decade following the 2008 financial crisis. While the Federal Reserve has been aggressively raising interest rates to combat inflation, these fixed-rate debts have shielded many households from the immediate impact of the rate hikes.
As of the first quarter, only 11% of outstanding Household Debt had rates that fluctuated with benchmark interest rates. The prevalence of fixed-rate debt is likely blunting the impact of the Federal Reserve’s rate increases, and Consumer Spending and Economic Growth have remained relatively stable.
BUT many individuals with low fixed rates on mortgages are “stuck” in their current homes as upgrading to a new home or car is now more expensive with higher mortgage rates. This phenomenon is contributing to a slower housing market and limited car purchases.
 The Existing Home Market in the US is facing challenges due to a persistent lack of SUPPLY, which has resulted in declining sales numbers. Existing Home Sales in June were down 18.9% compared to the previous year, primarily due to weak supply rather than weak demand. The supply of existing homes for sale has been historically low, with only 3.1 months of supply on average over the last five years, which is down from the usual 6-month supply and, this past year, we’ve dropped to a critical 1.6 month supply.
Why? People can’t afford to move! If you have a $400,000 home with a $350,000 mortgage at 3%, the monthly payments are $1,476/month. If you sell that home and try to move to another $400,000 house with a $350,000 mortgage at 7%, the monthly payments are going to be $2,329/month – that’s $853 (57%) more per month for the same-priced home!
At the current rate of 7.885%, moving out of a home with a $1,476/month mortgage, you can only afford a $200,000 mortgage so, unless you have $200,000 in equity in your existing $400,000 house – you are essentially trapped in it. AND, don’t forget there’s taxes and HOA fees and Maintenance Fees which have gone insane, as have repairs, painting, appliances, insurance, renovations – and don’t forget moving costs! You need to have a REALLY good reason to sell a house these days…
Despite the low supply, demand for homes remains strong, supported by a healthy Labor Market with an unemployment rate of 3.6% in June, close to a 50-year low. The combination of high demand from new buyers and low supply of homes has driven home prices to record levels, with the median sales price in June reaching $410,200, the second-highest since records began in 1999.
Home-builders are still doing well as people don’t want to risk “fixer uppers” in this market – despite what you may hear from 100 different home-improvement and house-flipping shows. Despite our low, current population growth, what drives the buy side of the home market is how many people are turning 30, which is when people tend to buy their first home and ever-rising rents are pushing others into the housing market as well.
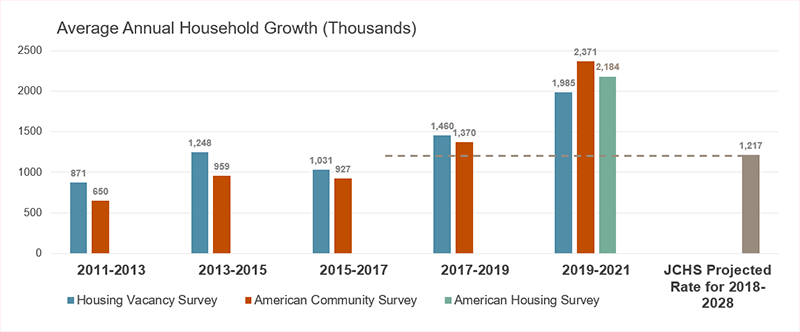
Much of the acceleration in Household Growth was driven by a pickup in growth among Millennials, continuing a longer-term trend that has been building since 2016. Indeed, while the number of older adult households has been growing significantly and steadily over the past ten years, the biggest changes in household growth over the past five years have been among adults under age 45.
The number of households headed by 25-34 year-olds grew by 300,000 per year in 2016-2021, up sharply from average annual growth of 45,000 households between 2011-2016, a difference of 260,000 additional households per year. The number of households headed by adults aged 35-44 grew even more rapidly, by fully 400,000 per year in 2016-2021 after having declined by an average of 150,000 per year in 2011-2016, which was a swing of 550,000 households per year in overall household growth among this age group.
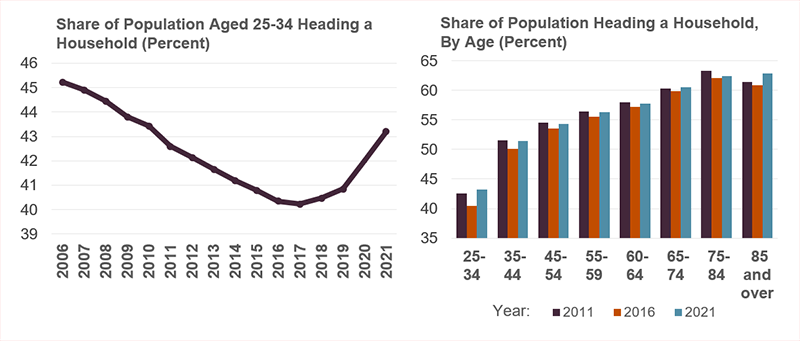
Such a pickup in growth in this age group cannot be explained by growth in the underlying population alone, and suggests older Millennials were now forming the households that had been delayed earlier in the decade. Now we are working off a 3-year backlog of demand from Covid, when people were putting plans on hold. The kids are getting back out of their parents’ houses and looking for homes of their own – only to find there’s not much available.
These are the kind of slow-moving macros we spoke about in a recent Webinar and the decisions the Fed makes today won’t always get felt in the economy for 6-18 months but traders, unfortunately, think the effects are immediate and analysts immediately price them into their targets – even when the path of the Fed going forward is still very uncertain.
8:30 Update: As if to underline my point, GDP came in way hot at 2.4% up from 2.0% in Q1 and 1.8% expected by leading Economorons. So, in short, the Fed has had NO EFFECT so far in cooling down the economy and that means they can’t be done hiking. Durable Goods orders were also on fire at 4.7% vs 0.7% expected by the same morons – they can’t even predict today and we are going to rely on their long-term forecasts?
Jobless claims FELL 3.4% from 1,749,000 to 1,690,000 Consumers are boosting their spending on experiences such as travel as well as big-ticket items. Americans are benefiting from a strong labor market in which wage gains recently surpassed cooling inflation. Of course, keep in mind that no one has been paying their Student Loan Debts all year – that has freed up a lot of cash to make the economy SEEM healthy.
Also thanks to Government spending, chip-manufacturing plants and electric-vehicle factories are offsetting private-sector cutbacks and, as noted above, the short supply of used homes is pushing home construction much higher.
Certainly things are too strong now to let fear drive us out of the market. I was on Bloomberg’s Money Talk yesterday and we added a very aggressive play on SunPower (SPWR) and also a trade for Lovesac (LOVE) in anticipation of more bullishness ahead and LOVE is already jumping this morning.
As long as we are AWARE of the dangers, we can hopefully steer clear when the time comes. Fortunately they seems to be slow-moving issues and we should have plenty of time to get clear when it happens.


