
 “Sticks and stones break my bones
Oh nooooooooooooooooo!
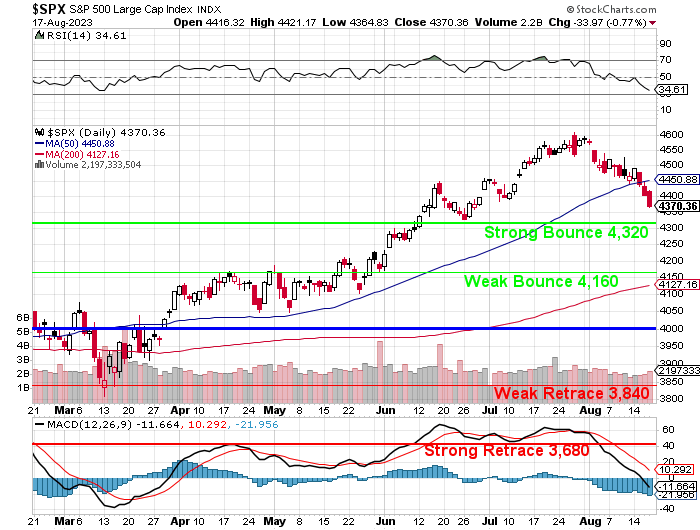
I tried to be optimistic, really I did. I even made a more aggressive chart for the S&P 500 in hopes earnings season would be good to us but here we are, back to our old S&P chart where, sadly, 4,000 is our base value line – that’s another 10% down from here. Notice how the ENTIRE 2023 rally only managed to get us over the Strong Bounce Line (4,320) for less than 3 months and now we’re back to testing it from above.
Fear not tough, our target for this pullback is only 4,200 (down another 5%), which is above the weak retrace and then, hopefully, we can rebuild a proper base from there and bring the new S&P chart back (see yesterday’s Report). On that chart (which assumes 10% inflation should equal 10% more S&P but, other than that, our targets haven’t changed from the above 2020 chart), 4,200 is the Weak Retrace of the assumed run to 5,000 (2025) – but not this year, where we expect to finish around 4,200 and no more than 4,400 – where we are (were) now.
Now don’t act all surprised or get disappointed. I have been telling you for YEARS now that the market had to prove they could make money WITHOUT the Government handing out an average of $4 TRILLION in stimulus each year for the past 3 years and, since Biden has kept it going in 2023 – we still don’t know what happens to us without stimulus.
The S&Ps forward p/e pre-Covid was about 24 and THAT was because Trump had slashed Corporate Taxes (still slashed), which boosted Corporate Profits (and bankrupted the country). Now it’s 27x forward earnings and forward guidance is coming down – so you can see where a 10% correction is not just expected – it’s necessary.
What is necessary is to make sure we’re comfortable with our hedges going into the weekend. As of Tuesday’s review, our Long-Term Portfolio was at $552,253 (LTP) and our Short-Term Portfolio (STP), with our hedges, was at $196,995 for net $748,918 after a $700,000 start in May – so up about 5%. As of yesterday’s close, the LTP sits at $512,279 and the STP is at $213,545 for net $725,825 so the LTP lost $40,000 and the STP mitigated about half the damage – that’s perfect.
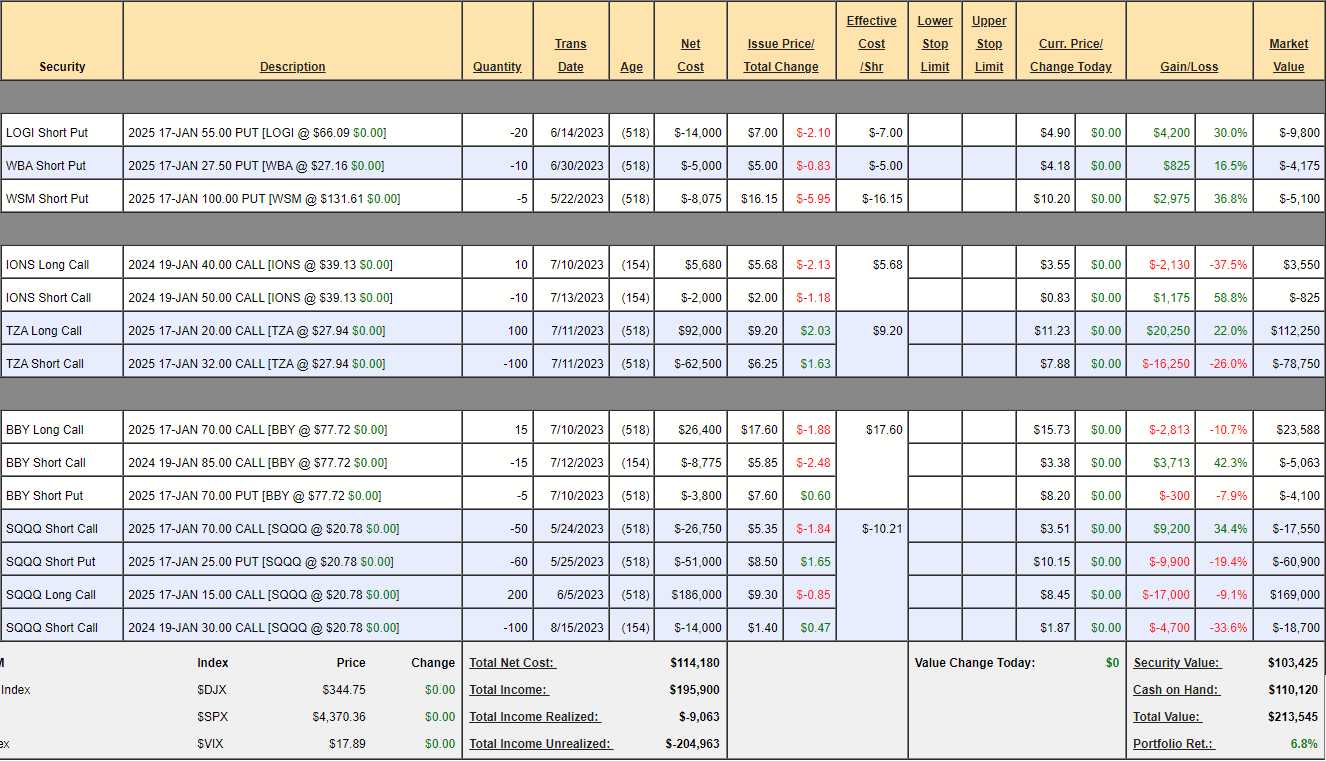
We don’t expect a huge correction, so we don’t want to be too bearish and we KNOW (because we did the math in the Portfolio Review), that we have, ultimately, $300,000 worth of protection in the STP so, if the LTP only lost $40,000 when the S&P fell from 4,500 on Tuesday to 4,350 yesterday (3.3%), then the 10% correction we expect should only cost the LTP about $120,000 which means we have PLENTY of protection for the LTP and our other portfolios.
See, it’s not a guessing game, Portfolio Management is about MATH! The best way to test our math is under genuine field conditions so we know how our portfolios actually perform under fire and big moves like this week are fantastic for gauging their effectiveness – as well as seeing how our longs hold up under fire.
We’ll see how Options Expiration Day holds up. 3.3% is between the 2.5% and 5% Rule and it matters A LOT which way we go today as finishing down 2.5% means this correction is likely to stop at 5% but finishing the week down 5% (4,275) would mean we are almost certainly on the road to a 10% correction – back at 4,000 in September (Fed meets on the 20th).
Have a great weekend,
-
- Phil


