
 Nothing!
The Fed did nothing and the the crowd is going wild! Yes, economics is very silly and we went over the statement in our Webinar and in the Live Member Chat Room so I won’t rehash it here – we’re just going to wait and see what the NYSE does – as it’s still at that critical 15,000 mark – the one that HAD to hold and didn’t.
It’s too late for backsies as the NYSE has already formed a Death Cross last week and that sort of technical damage is hard to repair but, if the Fed is willing to ignore Inflation and pretend all is well – then Inflation will continue to inflate the price of stocks along with their Revenues and Profits – this is why we maintain all those bullish bets in what is undeniably a “growth” environment – even when the growth is just an illusion.
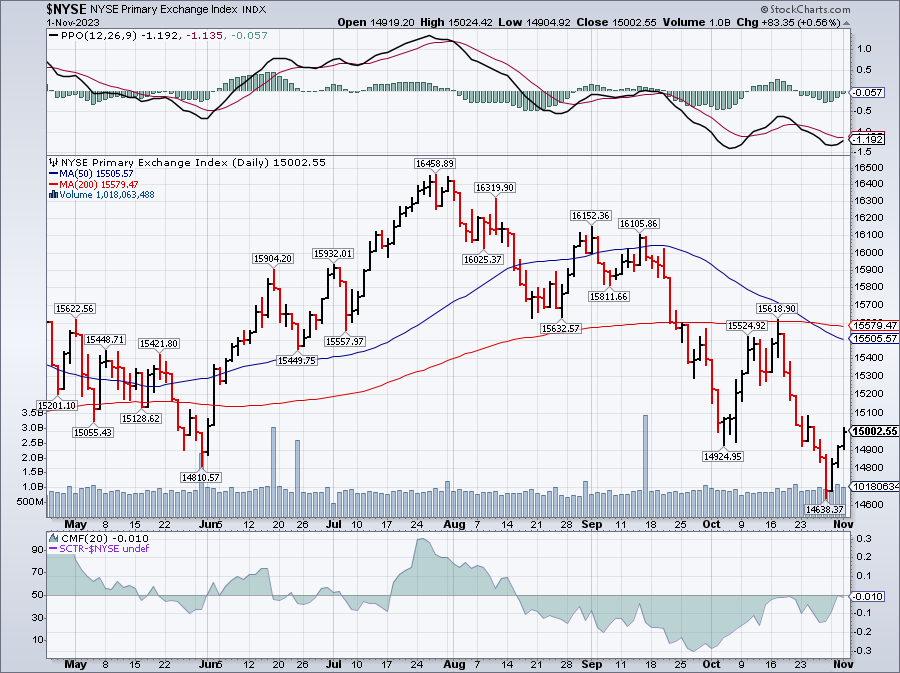
Let’s say 16,500 was an overshoot and below 15,000 was an overshoot and the fall was really from 16,000 to 15,000. That means our weak bounce line is going to be 15,200 (20% of the drop) and 15,400 will be the strong bounce and the 50 dma is falling at 10 points a day so it will be at 15,400 in 10 days (two weeks) – pretty much on options expiration day (17th) so I’d say if we’re not over 15,400 by then – we’re not going to be.
That being the case we’ll need to see at least 60 points today or the move up will be decelerating and, like the Wonkavator, we will be smashed into a million pieces if we try to get through the roof (50 dma) without enough thrust. We don’t “read” charts – we use math and probabilities to determine what the chart WILL look like in the future.
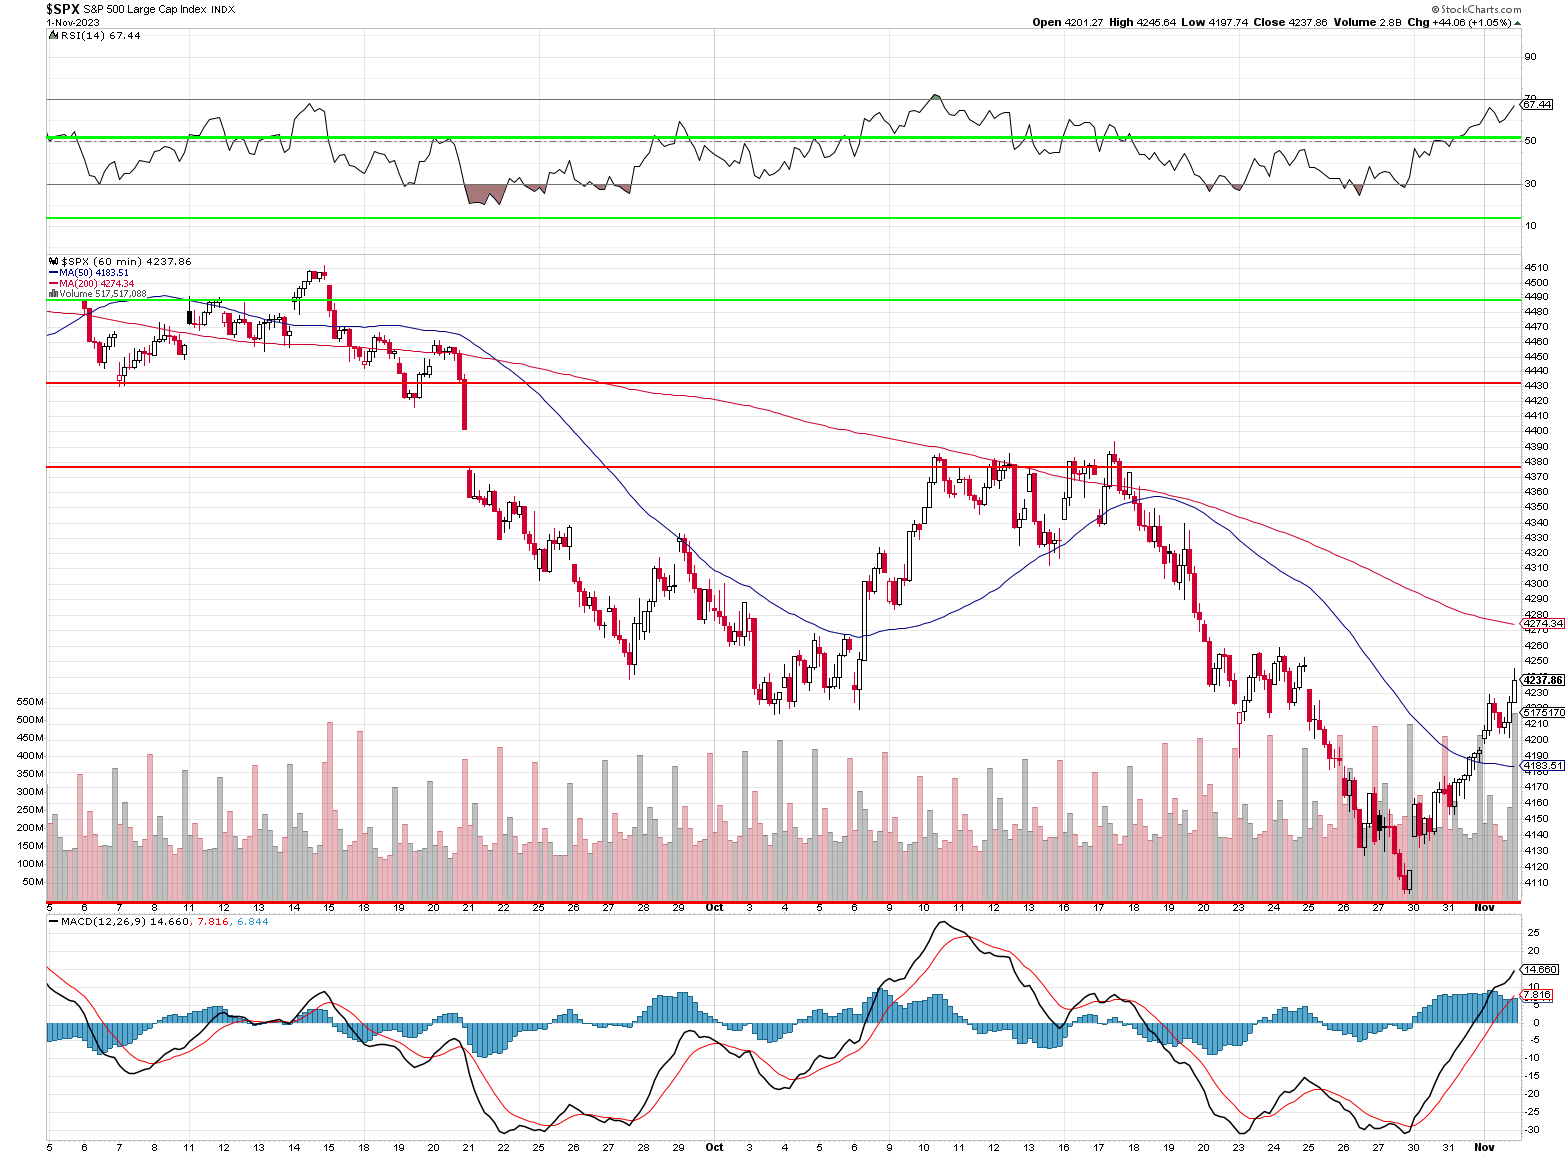
This is the hourly chart of the S&P so the 50-hour moving average is fairly meaningless and the 200-hour moving average is market hours so 7 per day is 28 days and that’s 6 weeks – 1/10th of the 50 dma so 1/10th as effective. In other words, don’t take them seriously at all but DO take seriously the RSI (top line) and MACD (bottom line) as a reading of RSI 67.44 suggests the market is overbought and may reverse soon and a reading of MACD 14.66/7.8 suggests the uptrend is likely to exhaust itself before we reach that 200-hour line at 4,274.
If we do break higher, then we’ll stick with our current hedging but, if we don’t hold it into the weekend – we’ll get a bit more aggressive with our downside protection. For now, keep in mind the markets are reflecting a 1% drop in the Dollar since the rate decision just 2 market hours ago so nothing less than a 2% rise in the indexes would be considered bullish at all.
Socks are priced in Dollars so if the Dollar goes down, the price of stocks go up automatically – simply because you need more Dollars to buy the same amount of stock – no different than Gold or Goldfish, for that matter. 2% of the NYSE is 30 points – won’t be impressive at all.
Meanwhile, earnings are much less red this morning and THAT is what we are paying attention to. Last night was much uglier with guide-downs from ABNB, ALB, AWK, ANSS, ACLS, BMRN, BXP, BWXT, CTSH, CFLT, CLB, CCRN, CSGS, SW, DXC, EGHT, ELX, ET(!), FARO, FORM, HST, IR, KW, LMAT, VAC, MKRI, NVRO, NUS, NTR, PYPL, PTC, QRVO, QCOM, RRX, REZI, SEDG, SRI, SMCI & ZG. And those are JUST the companies that lowered guidance, not including the misses and, of course, not everyone gives guidance.
This is where AI comes in handy because I was able to ask ShelBot if he saw any patterns:
🤓 I did some research on the companies that lowered their guidance and found some possible patterns. Here are some of them:
-
- Some companies lowered their guidance due to the impact of the COVID-19 pandemic and its variants on their business operations, demand, supply chain, and costs. For example, ABNB1, HST2, VAC3, and NTR cited the pandemic as a factor that affected their outlook.
- Some companies lowered their guidance due to the increased competition and pricing pressure in their markets. For example, PYPL, QCOM, QRVO, and SEDG mentioned the competitive environment and the need to invest more in innovation and customer acquisition as challenges for their growth.
- Some companies lowered their guidance due to the regulatory and legal uncertainties or changes that could affect their business. For example, ET, CFLT, NUS, and ZG referred to the potential or actual litigation, regulation, or legislation that could have a negative impact on their operations or profitability.
AI is great but I know that HLT and MAR did not use Covid to excuse their results so perhaps Covid is a crutch for CEOs who miss the mark? QCOM is being forgiven as they have a tremendous long-term outlook and I’m not worried about ET – as long as they keep paying that dividend (9.5%).
This is what hedging is really about. If you don’t think the market has a chance, then CASH!!! is king. We cashed out our 2019 portfolios in April, when we recovered from the March dip as we had fantastic 4-year profits and wanted to put that money on the sidelines and start a fresh batch. Hedging let’s us ride out these dips and even gives us the money we need to IMPROVE our long positions on these dips – it becomes almost an automatic process…
It’s been an uneven recovery since then but there are plenty of bargains still to be had and, between now and Thanksgiving, we’re going to be re-reviewing our Watch List stocks, which we last examined in “Watch List Wednesday – Bargain Hunting During the Sell Off” back on Sept 27th and, as you can see on this Nasdaq chart – we’re only just now getting back to those Sept 27th levels so it’s a good time to do a little browsing.
Our hedges let us ride out this little storm (assuming it’s over) and now we are post-earnings and we can re-examine our positions in light of the new Q3 data and, of course, GUIDANCE!
Interested in joining us inside? You will gain access to our portfolios, live chats, and other member-exclusive perks!
Email Maddie at Admin@philstockworld.com for a seven day free trial at sign up.

")


