
Sorry but it’s time for reality.
I know no one wants to hear that so close to Christmas but, as I noted for our Members yesterday, several things are happening at the same time and one of them is the Dollar completing a 5% correction (107 to 101.65) from which it bounces to 102.72 (weak) and 103.79 (strong) and that’s going to put pressure on markets.
At the same time, the markets are putting pressure on themselves as the S&P gets back to 4,800 and the key pressure gage for the S&P is the RSI and that’s just under 70 which, as you can see, doesn’t generally happen. The last time RSI hit 70 was August and we pulled back from 4,600 to 4,100 (10.8%) and the time before that – well, let’s not get into the time before that – it’s depressing!
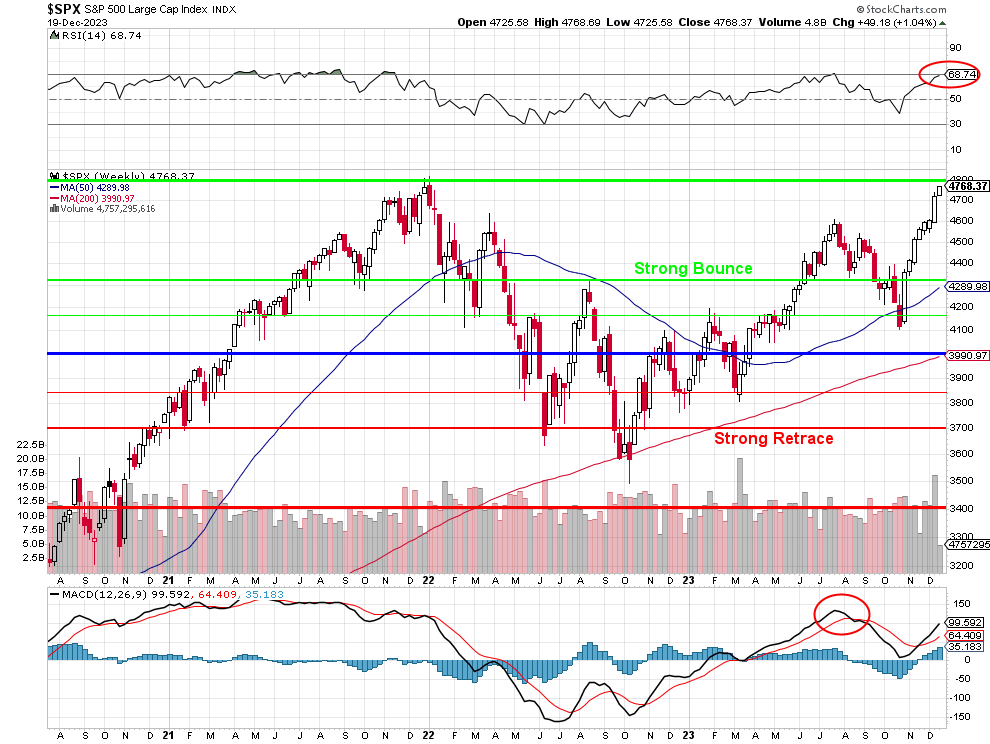
We did scoot along at 70 from early 2021 until the end of the year but that was back when the Government was still dropping a ton of stimulus on us. Interestingly in the WSJ this morning it is pointed out that the real GDP has gone from $21Tn in Jan of 2020 to $22.5Tn today and that’s up 7.14% over 4 years and it only cost us $11Tn in debt (47% expansion) and $7Tn on the Fed’s balance sheet to get us here!
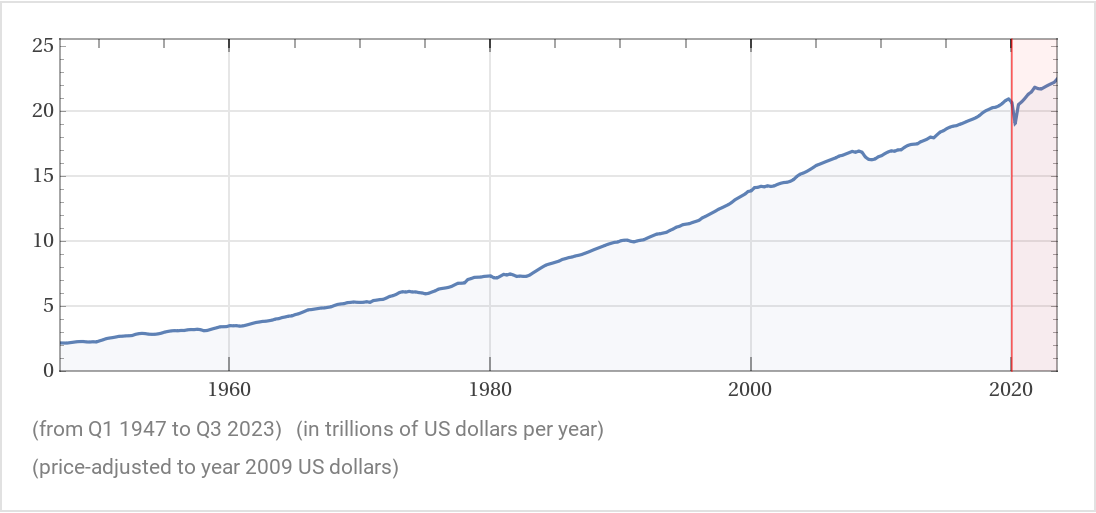
The S&P, however, is up 50%, from 3,200 in Jan 2020 to 4,800 now is a really nice run – especially for an economy that has only grown 5% but, to be fair, that’s adjusted for inflation and our nominal GDP is now $27.5Tn and that’s up $7Tn (34.1%) from $20.5Tn thanks to the deflated buying power of the US Dollar (it was 114 in September of last year!).
So, pretending that inflation isn’t a thing, we’re paying 50% more for stocks than we did in 2020 (when we thought things were going well) against a 34.1% rise in GDP and we’ll ignore the $18Tn in debt and Fed stuff that got us here as if it was a gift we’ll never have to pay back and that would mean the market is only gaining at a 47% greater pace than the actual economy – what could go wrong?
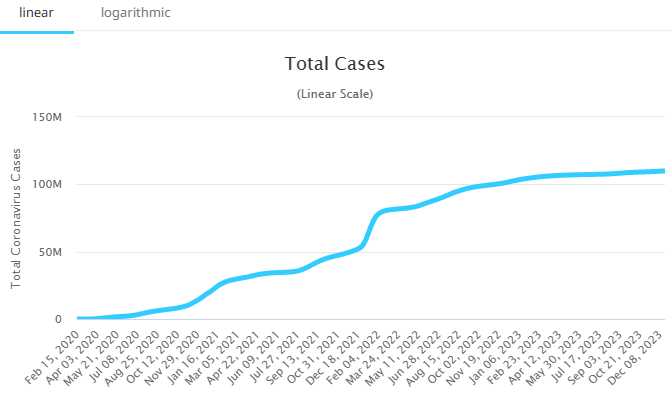 But Phil, we’re so happy to be done with Covid – that should count for something! You are right, we’ve had 100M cases of Covid since Jan 2020 in the US and that’s over 48 months so 2M cases a month on average and now, since October 1st, we’ve only had 1M new cases – problem solved!
Of course Covid is like our Debt – if we don’t test for it, we can pretend it doesn’t exist, right? Like our Debt, we were making progress but there’s a large segment of the population that refuses to do anything about it – so now the problem has come back again and we’re all in no mood to talk about it so I’ll stop…
As noted in the WSJ, the pandemic has changed the economy, profound shifts have occurred in consumption patterns, work dynamics, and inflation and interest rate expectations. These changes might not have altered the broad economic trajectory but have significantly impacted how economic activities are conducted. The pandemic led to a sharp but one-time (we hope) rise in prices without triggering a wage-price spiral or un-anchoring inflation expectations (so far).
There’s been a significant shift towards remote work, reduced working hours, and a change in consumption patterns from services to goods. These shifts have broader social implications, altering family dynamics and societal structures. Altered consumption patterns reflect a significant societal transformation which has implications for various sectors, from real estate to technology, and could influence our long-term investment strategies.
It’s almost like the economy took a short nap during the pandemic, woke up, and decided to continue its journey with a slightly different outfit. The core remains the same, but the accessories (work dynamics, consumption patterns) have changed.
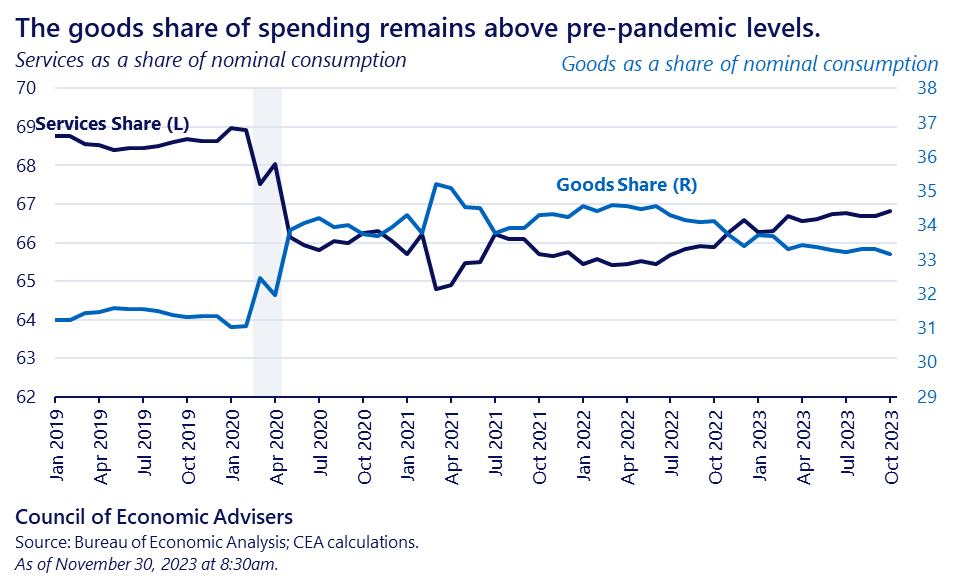
The goods have been doing well during the pandemic and services have just started coming back. As I also noted recently, travel is very strong this year but that’s because we’ve all been stuck in the house for 3 years and we put off a lot of visits and vacations – there’s no guarantee that will continue next year as the LACK of that wage-spiral means the consumers are running out of money – that’s a dangerous trend but services are still 5% below the norm and goods are still 5% above.
Oil hit $75 again this morning thanks to relentless attacks that are closing the Suez Canal and the Panama Canal is suffering from a drought so shipping is going to drive the next wave of inflation in Q1 but the US exports more petroleum than it imports oil – so I don’t see that becoming a big issue over here.
All in all, as I noted yesterday in our Live Member Chat Room – we’re expecting a 3% pullback on the indexes, which will be 4,600 on the S&P 500, which was our July high. If we bounce off that (strong) back over 4,700 – then we may be consolidating for a move up but, if we fail, we have a very good chance of revisiting 4,400 in Q1 and that will start a bit of a panic.
We hedged ourselves to neutral into the holidays and we’re pretty much waiting for earnings before we make any major adjustments. Sometimes, there’s not much to do but sit back and watch to see how things turn out…
We will be having our weekly seminar at 1PM-3PM EST.
Today’s topic is hedging our portfolios into the holidays! Hope to see you there!
https://attendee.gotowebinar.com/register/8257573553617266012


