
Are we topping out?
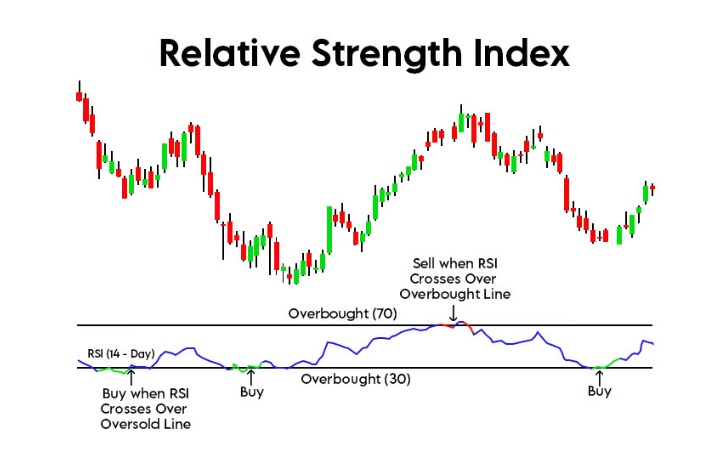
I’m not a big fan of TA but the Relative Strength Index (RSI) is a momentum oscillator that measures the speed and change of price movements of a security – this is science and math, not the Rorschach nonsense that gives Technical Analysis a bad name. RSI is measured on a scale from 0 to 100 and is typically displayed as a line graph like the one above.
The RSI helps identify overbought or oversold conditions in the trading of an asset. Traditionally, an RSI reading above 70 indicates that a security or index may be overbought or overvalued and could be primed for a trend reversal or corrective pullback in price.
-
Momentum and Price Extremes: The RSI is a momentum oscillator, meaning it is designed to identify the speed (velocity) and change (magnitude) of price movements. An RSI value over 70 suggests that recent gains far outweigh recent losses, indicating strong upward momentum. This level is considered extreme because, historically, securities tend to revert to a mean after reaching such extremes in momentum.
-
Market Psychology: The concept of overbought conditions reflects market psychology and the cyclical nature of trading. When the RSI exceeds 70, it implies that the security or index may have been bought aggressively by the market participants, pushing the price up at a rapid pace. This aggressive buying can lead to a situation where the security is overvalued in the short term, and many traders might consider taking profits, leading to a potential pullback or correction.
-
Reversion to the Mean: Financial markets are characterized by periods of trends and mean reversion. An overbought RSI level suggests that the security’s price has risen sharply and might be due for a reversion to its mean or average level. The idea is that after such strong buying pressure, the likelihood of a decrease in buying momentum or an increase in selling pressure grows, potentially leading to a price decline.
-
Historical Observation: The threshold of 70 as an indicator of overbought conditions is based on historical observation and statistical analysis. J. Welles Wilder, the creator of the RSI, determined through his research that levels above 70 (and below 30 for oversold conditions) effectively signaled extreme conditions that were likely to precede reversals or slowdowns in momentum.
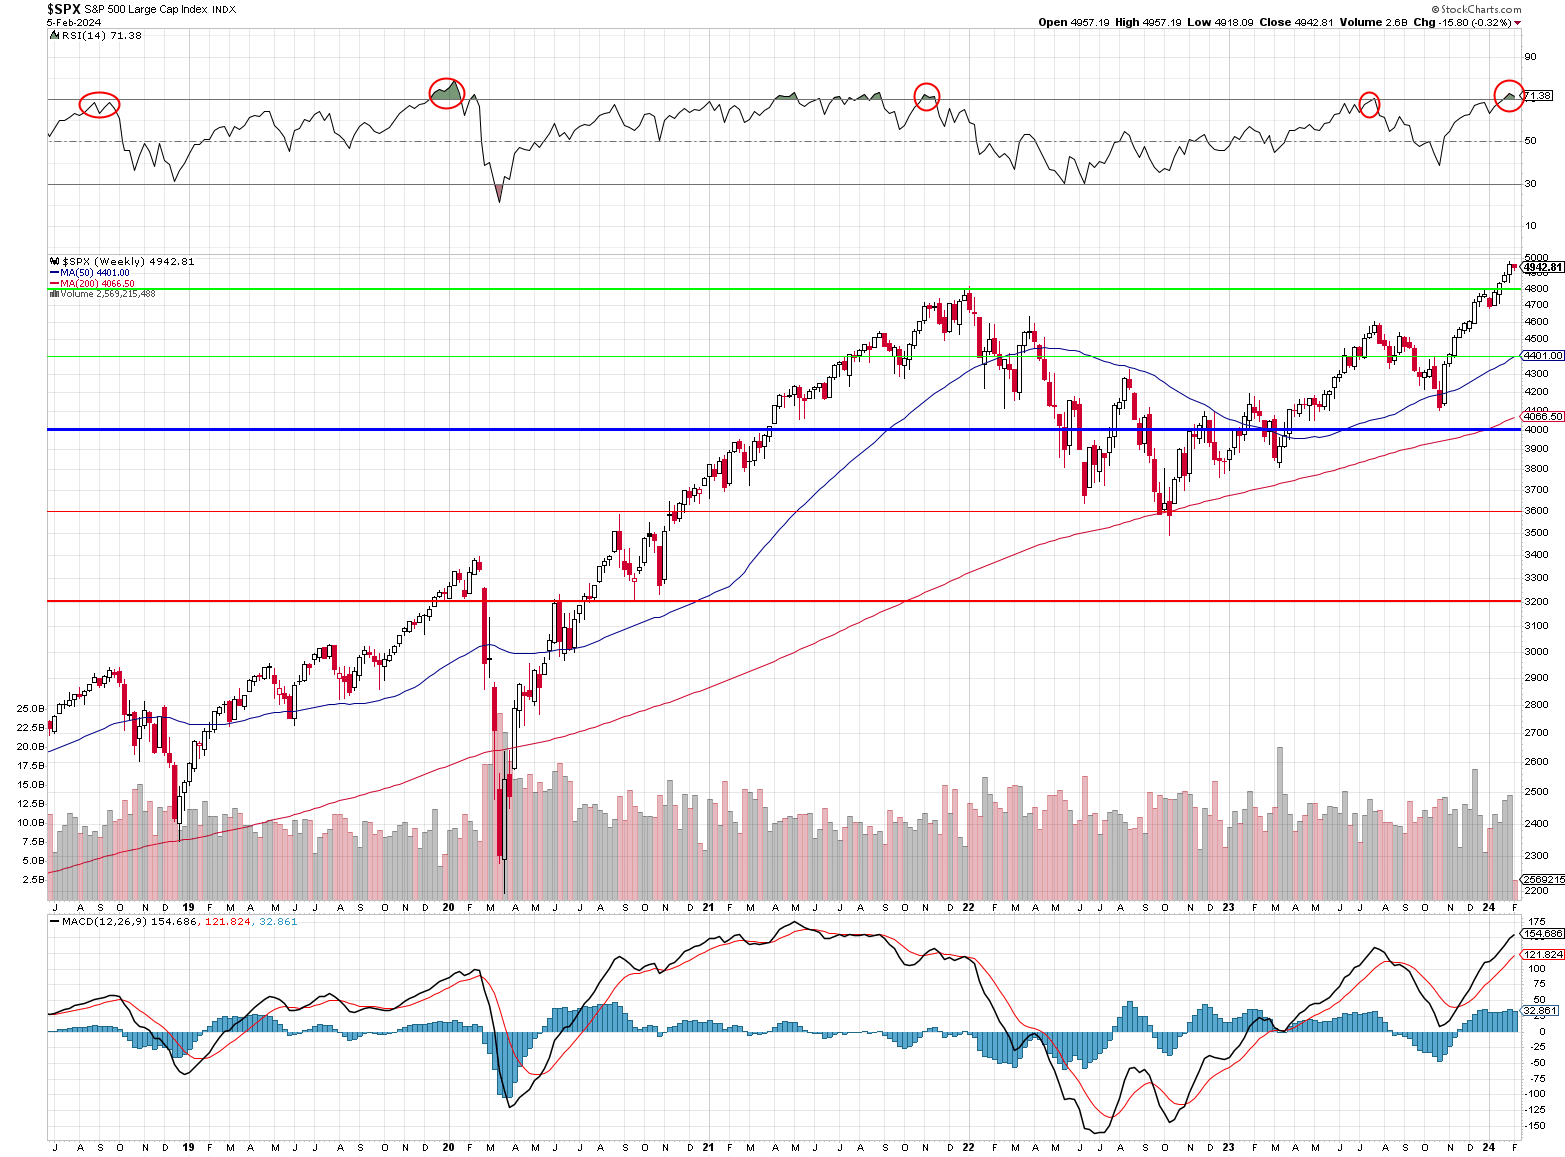
As you can see from the weekly S&P 500 chart, it has been fairly reliable – except for 2021 (recently), which was due to massive stimulus at the time – so it does not constitute a failure for the indicator. The oversold line at 30 has proven just as reliable, hasn’t it?
Of course no single indicator guarantees a result but taken in conjunction with not very exciting earnings, a rough Global Macro Picture, a Fed that’s not easing in the next few months and historically stretched valuations and it begins to paint a pretty clear picture of what’s likely to happen – soon.
S&P 5,000 was bound to be a tough nut to crack anyway. We’ve had a huge run since late October from 4,100 so 20% of that is 4,920 so the 5% Rule™ (which is NOT TA – it’s just math!) tells us the 820-point run has 164-point lines around it so an overshoot of 4,920 is 5,084 while a weak retrace would be 4,756 (where you can see we consolidated in Dec and Jan) and a strong retrace would be 4,592 – where we topped out in July, as well as March of 2022.
The Magnificent 7 stocks have already weighed in and they are now $13Tn (31.7%) of the S&P 500s entire $41Tn market cap and they are ALL 4-letter Nasdaq 100 stocks and that index has a market cap of $22.7Tn – so the Mag 7 are 57.3% of the entire Nasdaq 100 – and that’s not even counting GOOGL with GOOG!
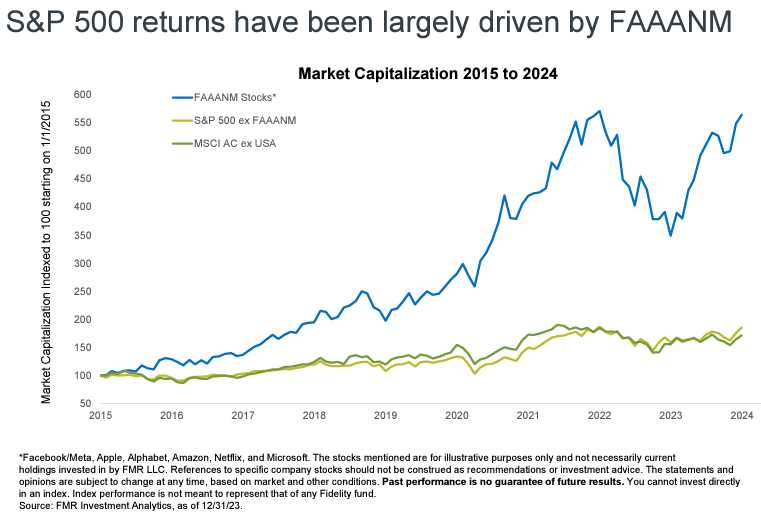
So how much are the rest of the S&P (68.3%) and the rest of the Nasdaq 100 (42.7%) going to be able to move the needle for their indexes? As I pointed out long ago – META, AAPL, GOOG/L, AMZN, NVDA and MSFT are some of the VERY FEW companies that are actually making money selling AI while the other 489 S&P 500 companies are CONSUMERS of AI and they are all hoping the spending they are doing now leads to efficiencies down the road – but it won’t happen in Q1 (or Q2)!


 of the S&P 500 Worth $21.5Tn Are Reporting!")