
“Relax – It’s just a little pinprick” – Pink Floyd
“Relax
I’ll need some information first
Just the basic facts
Can you show me where it hurts?“
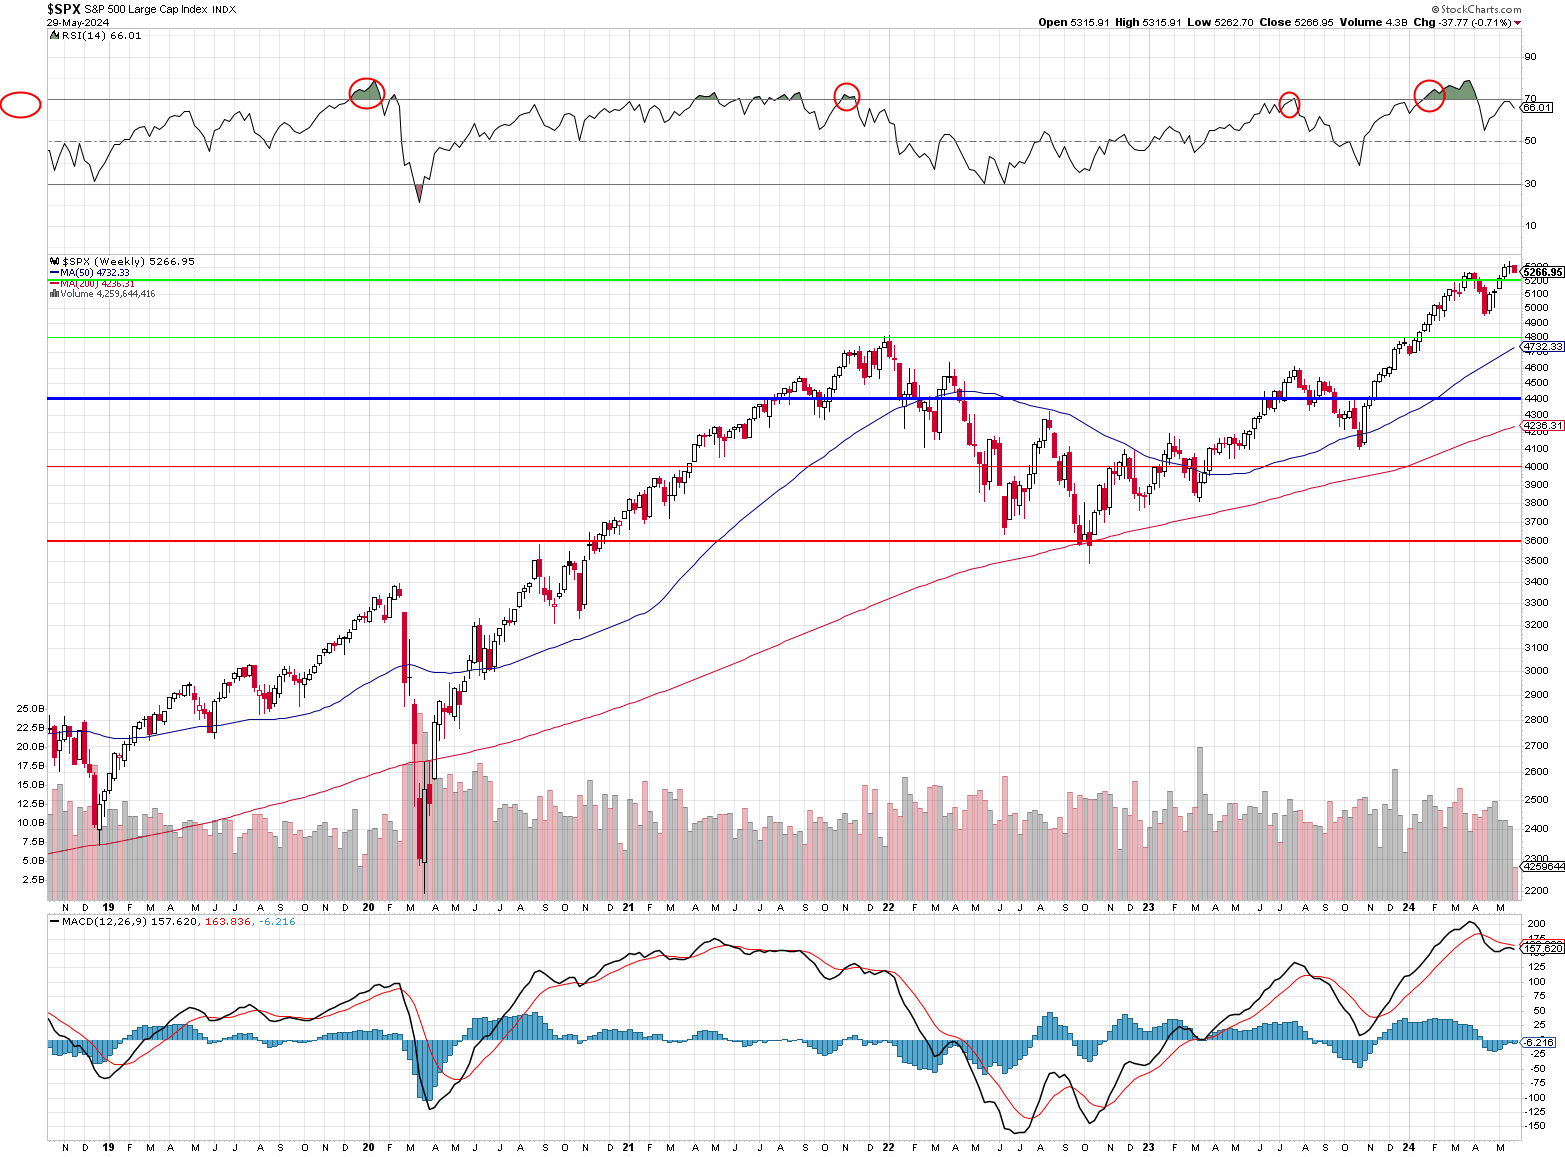
It is just a little pinprick as we pull back from 5,300 on the S&P 500 after blasting up from our 4,400 (inflation-adjusted) base-line since the literal Fall but it was a legitimate breakout from the bottom of the range we’d been in since 2021 and it looks like that 200-week moving average is going to hit 4,400 by the end of the year and that should firm up that base-line very nicely.
Our 5% Rule™ dictates that we use the range from 4,400 (consolidation) to 5,200 (next major support) to calculate our current bounce lines so that’s going to be 20% of 800 is 160 points each which means our daily chart should look like this:
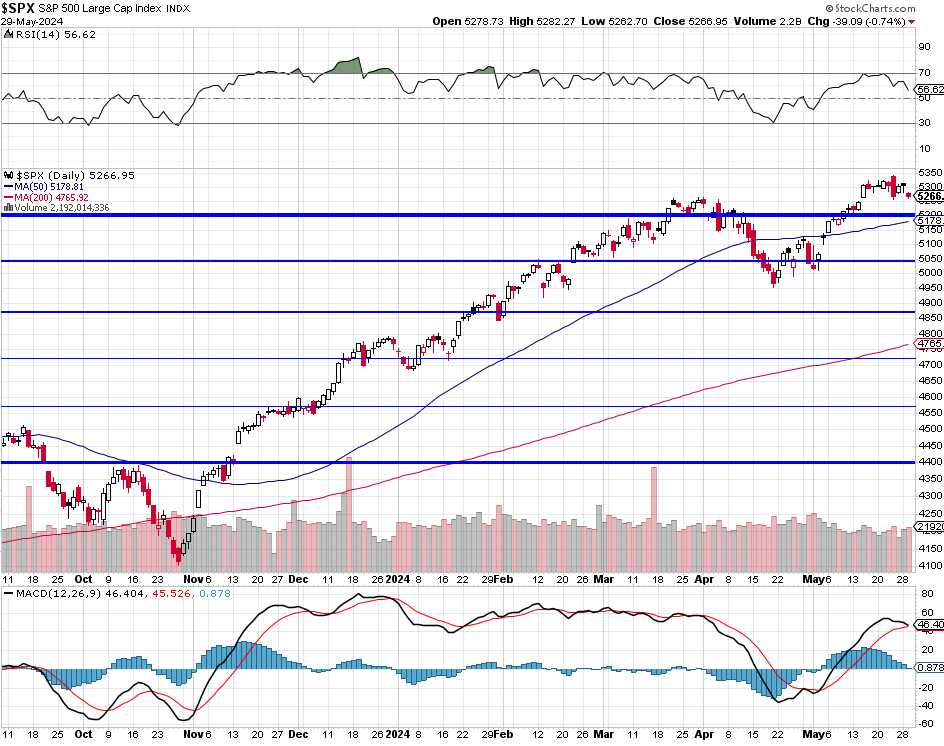
5,040 is what we call a “Weak Retrace” (of the run from 4,400) and a “Strong Retrace” is another 160-points lower at 4,880 and you can see how those ranges are being obeyed so the 5% Rule is well in effect – as it usually is when the market is dominated by algorithmic trading – which is always this century…
Notice that 50-day moving average is about to cross over 5,200. If that happens, that line will firm up as good support and we’re 21 below 5,200 and the index and the S&P is at 5,235 this morning (7:45) so 135/50(days) is 2.7 points per day so we need the S&P to stay this far above 5,200 for 2 full weeks in order to get the 50 dma over 5,200 and, until then – we are in danger of being rejected at that line and suddenly we’ll have an ugly chart.
See – understanding the math that WILL drive the creation of the next chart puts you head and shoulders above TA traders – who only witness the aftermath of the the math that goes into creating these images and then, without using math, they try to pick a pretty pattern that matches what they see – as if this is somehow foreshadowing the future. Silly TA people…

Now Smart Fundamental Investors are going to dig into the macros that will influence the next 2 weeks of trading and we did indeed look ahead in yesterday’s Webinar and there’s a lot of tough data coming down the pike – including this morning’s GDP report – where there is a wide discrepancy between reality and expectations:
8:30 Update: 1.3%! As we discussed in the Webinar yesterday, there’s was nothing in the recent data that suggested an upward revision to GDP and, in fact, we’re DOWN 0.3% from 1.6% in the first estimate of Q1 while the GDP Deflator (which measures the change in prices) remains stubbornly high at 3% – still 50% over the Fed’s target and slowing economy + high inflation = STAGFLATION, which is not good.
The disappointing GDP report only adds to the growing concerns that have been weighing on the markets recently. With inflation proving more persistent than anticipated and economic growth showing signs of slowing, investors are becoming increasingly worried that we could be heading into a period of stagflation reminiscent of the 1970s.
This fear was echoed by JPMorgan CEO Jamie Dimon, who warned that the extensive fiscal and monetary stimulus over the past five years could lead to an unwelcome surprise of high unemployment, inflation, and low demand. Dimon believes the odds of stagflation are much higher than what most people think.
The bond market is also reflecting these concerns, with Treasury yields spiking higher as investors reassess their expectations for Fed rate cuts. The 10-year Treasury yield has climbed back to 4.6%, and there are worries it could return to 5% – where it was in April. The rise in yields is putting pressure on stocks, especially our growth-oriented tech companies.
Despite the Fed’s aggressive rate hikes, inflation has proven stickier than expected. The core PCE price index, the Fed’s preferred inflation gauge, accelerated to 3.4% in the first quarter from 1.8% in the previous quarter. This lack of progress on the inflation front is making it increasingly difficult for the Fed to justify rate cuts anytime soon.
This shift in rate cut expectations, along with the weaker GDP print and persistent inflation, is souring the mood in the markets. Stock futures are pointing to a lower open, with the Dow set to drop over 300 more points this morning. The S&P 500 is on track for a second day of declines, while the Nasdaq is coming off its worst day since May 1st.
Adding to the market jitters are concerns about consumer spending, particularly among lower-income households. While leading economorons believe the robust job market, slowing inflation, and even crypto gains will support consumption, rational observers may worry that the cumulative impact of high prices will eventually take their toll.
All eyes will be tomorrow’s PCE Report for further clues on the price pressures and we still have Williams and Logan speaking this afternoon and Bostick wraps up the month tomorrow after the close.
While a soft landing is still possible, it’s looking like we’re coming in on a 737 Max – so let’s not get too comfortable and, for God’s sake – don’t lean on the doors! The Fed has to walk us between taming inflation and avoiding a recession and, as the market narrative shifts towards stagflation risks, volatility is likely to remain elevated in the near term.
“We’re just a joke they sometimes crack, they’ll get away with anything
The government is holding back, they won’t say a word
Now is that a light in sky or just a spark in my heart?
Can I accept this as evidence or will that tear the whole act apart?” – Graham Parker


