


Real-time market updates for traders bring together economic event commentary, curated headlines, bid and offer quotes, and order-book depth, so you can read both the news and the market’s response. In the United States, regular market hours are 9:30 AM to 4:00 PM ET. A headline can explain why prices are moving; quotes and depth show how trading is unfolding.
Fast data is useful, but context helps you distinguish a market-moving development from background noise. This guide explains how to assess event commentary and curated headlines, interpret bid and ask quotes, and use order-book depth without treating any single signal as the whole story. It also covers how trading hours and data delays affect the picture, and how to include these live inputs in a more considered market view.
Key Takeaways
- Use the economic calendar to prepare for scheduled catalysts, then compare commentary with the market’s actual reaction.
- Read curated headlines for both the reported event and the asset’s response; the connection can reveal what traders are reacting to.
- Use order-book depth to inspect displayed buying and selling interest, while remembering that visible liquidity is only part of the picture.
- Compare the best bid and offer to understand the spread and the prices currently available at the top of the book.
- Before relying on a data feed, understand its update timing and whether its quotes are real time or delayed.
Economic calendar and event commentary
U.S. exchanges are generally open Monday through Friday, and regular market hours are 9:30 AM to 4:00 PM ET. Premarket trading runs 4:00 AM to 9:30 AM ET, while after-hours trading runs 4:00 PM to 8:00 PM ET; all times are Eastern Time, and holiday schedules can change whether sessions operate.
An economic calendar helps traders spot scheduled events that could move stocks, currencies, or commodities. Start with the event time, identify the release or earnings report, and note which assets it may affect. Then compare the result with forecasts and watch how prices respond. The calendar sets the scene; live quotes show the market’s reaction.
Earnings calendars add company-specific catalysts to the schedule. CNN’s economic calendar lists Tuesday, October 20, 2026, with several companies reporting before market open. Mercantile Bank Corporation’s earnings estimate is 1.35 USD. Peoples Bancorp Inc.’s estimate is 0.93 USD, while Commerce Bancshares, Inc.’s is 1.07 USD.
The same calendar lists Dime Commercial Bancshares, Inc. at 0.86 USD and Synchrony Financial at 2.42 USD. Northrop Grumman Corporation’s earnings estimate is 7.18 USD. Each is listed for October 20, before market open. These estimates are expectations, not reported results, so traders can compare them with actual releases once published.
That comparison matters because a result above estimates does not automatically make a stock attractive. Traders also weigh the company’s outlook, what the market had already expected, and the price response. A stock can fall after strong earnings if traders expected even more. Before deciding whether to buy or sell, consider the scheduled catalyst alongside the existing trend and the risk you can afford.
Economic events work similarly. A calendar can flag a data release, while commentary can help explain its relevance to policy, inflation, or growth. Check the timing and forecast, then watch whether the release shifts expectations. For example, an inflation surprise may move currency pairs as traders reassess interest-rate expectations. The direction and scale of any move depend on market positioning and the details of the release.
Build a repeatable routine around the calendar. Review upcoming events before trading, note which holdings or watchlist stocks could be exposed, and set alerts for key release times. After an event, compare the result with the forecast and see whether prices sustain their initial move. A stock split, for example, increases the number of outstanding shares without changing the company’s overall market value. Distinguish that mechanical adjustment from new information about the business.
Analyst-curated real-time headlines
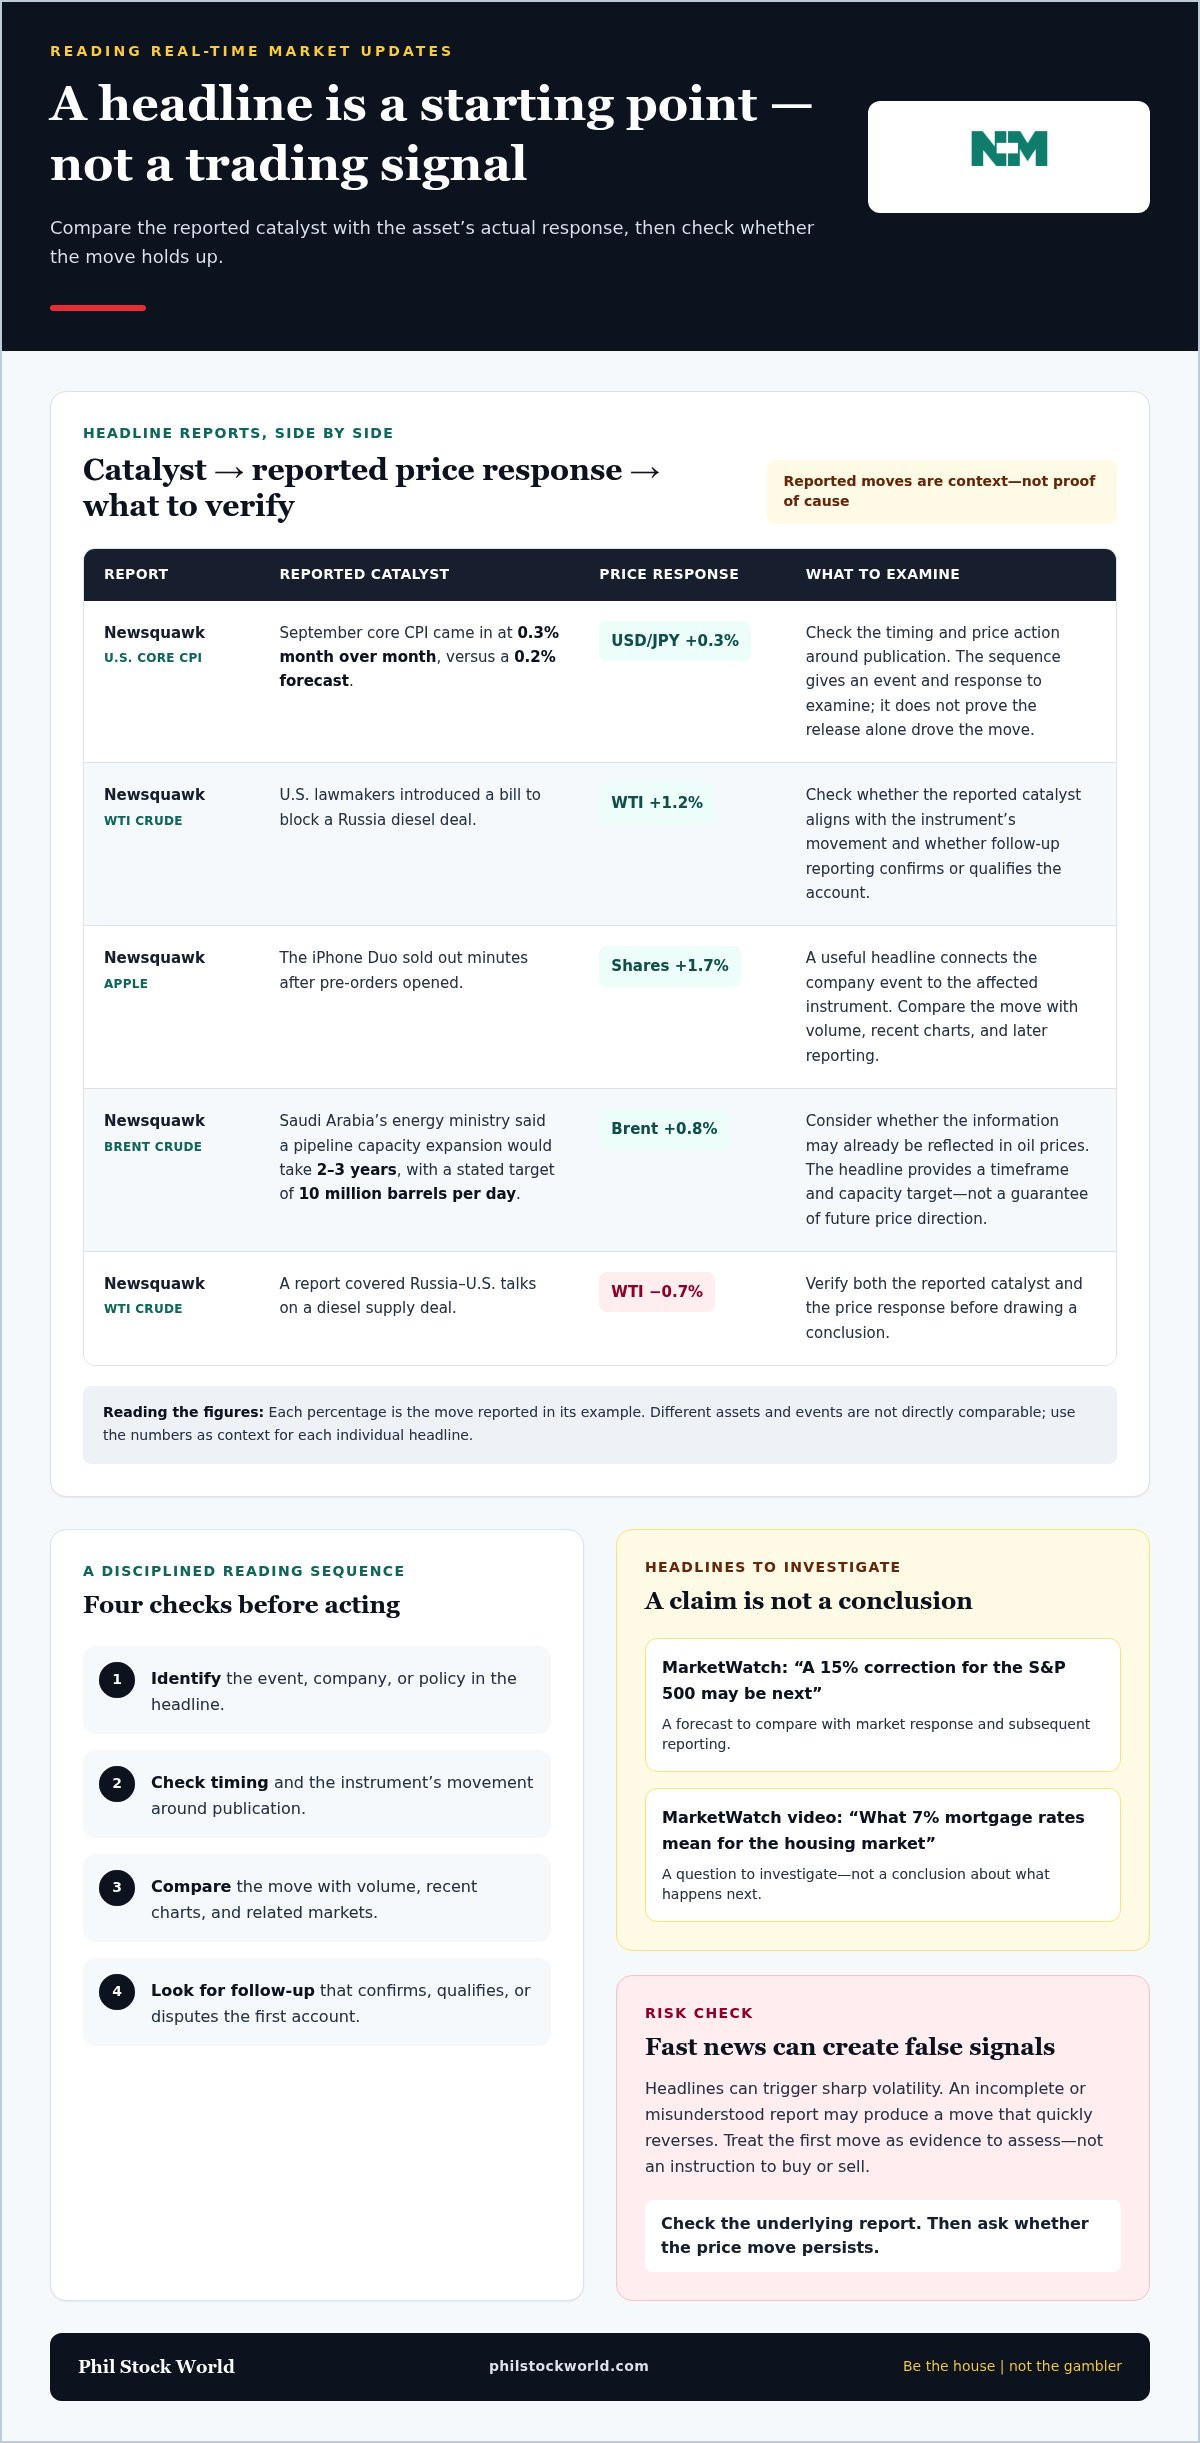
A headline is a starting point, not a trading signal. Curated feeds can connect a global event with the instruments reacting to it, helping you move from breaking news to a focused question: what changed, and what does the price confirm? Separate the reported event from its interpretation, then compare both with price action, trading volume, and charts before changing a position.
Consider a Newsquawk report on U.S. core CPI for September. The measure came in at 0.3% month over month, versus a 0.2% forecast, and USD/JPY rose 0.3%. That sequence links an inflation surprise with a currency move. It doesn’t prove the release alone drove the move, but it gives traders a concrete event, forecast, and price response to examine.
Another Newsquawk headline reported WTI crude rising 1.2% after news that U.S. lawmakers introduced a bill to block a Russia diesel deal. In a separate report, Apple shares rose 1.7% after the iPhone Duo sold out minutes after pre-orders opened. These examples show why useful curation names the catalyst and affected instrument. A headline without that connection leaves traders guessing.
Use a quick reading sequence before acting:
- Identify the event, company, or policy mentioned in the headline.
- Check the time and the instrument’s movement around publication.
- Compare the move with volume, recent charts, and related markets.
- Look for follow-up reporting that confirms, qualifies, or disputes the first account.
For instance, Newsquawk reported Brent rising 0.8% after Saudi Arabia’s energy ministry said an oil pipeline capacity expansion would take 2-3 years. The stated target was 10 million barrels per day. That headline gives a timeframe and capacity target, but traders still need to consider whether the information was already reflected in oil prices.
What are the risks of trading on real-time market updates, including volatility and false signals? Headlines can trigger sharp volatility, while an incomplete or misunderstood report can create a false signal that quickly reverses. Treat the first move as evidence to assess, not an instruction to buy or sell. Check the underlying report and whether the price move persists.
Technical analysis can add context, but it shouldn’t turn a headline into certainty. Mark the relevant price area on charts, then watch whether volume supports the move or fades. Compare related instruments when the story affects a sector or commodity, and note whether fresh information changes the original premise. For a broader view alongside headline monitoring, explore market charts and analysis.
MarketWatch’s headline said a 15% correction for the S&P 500 may be next, while its video headline discussed what 7% mortgage rates mean for the housing market. Both frame issues to investigate rather than conclusions; compare the claims with the market response and subsequent reporting.
Newsquawk reported WTI crude fell −0.7% after a report about Russia-U.S. talks on a diesel supply deal. Verify the reported catalyst and price response before drawing a conclusion.
Full and aggregated order-book depth
An order book displays resting buy and sell interest at different prices. The bid side shows buy orders; the ask side shows sell orders. Each displayed level pairs a price with available quantity. Traders use this snapshot to see where orders are concentrated, not to predict where a stock must go.
Full depth shows individual price levels and their displayed size, sometimes across multiple venues. Aggregated depth combines orders at matching prices, giving a clearer view of total visible interest. A platform may offer one format or both. Check what each display includes before comparing feeds, since their coverage can differ.
Imagine a stock trading near a cluster of visible buy orders. The cluster may indicate potential support because buyers have placed interest there. But those orders can change or disappear before execution. Treat depth as a live snapshot, not a promise that the displayed shares will remain available when your order reaches the market.
Read the book from the inside out:
- Locate the best bid and offer, then note the spread between them.
- Compare displayed size at nearby prices on both sides.
- Watch whether visible quantities grow, shrink, or move as prices change.
- Compare the book with executed trades and the price chart.
That distinction matters: a large displayed order can attract attention, but executed volume shows where trading actually took place. If a price level appears crowded yet trades pass through it, the visible interest may not be holding. Conversely, repeated executions near a level can help technical analysis identify an area traders are actively testing.
Aggregated depth is useful for a quick read of overall supply and demand. Full depth can show how visible interest is distributed across price levels or venues. Neither view captures every possible order or guarantees a complete picture of market liquidity. A screen can look thick even as available interest changes rapidly, especially during a news-driven move.
For an investment decision, use the book as context rather than a standalone trigger. First identify the price area relevant to your trade. Then observe whether displayed interest persists, executions confirm it, and the broader chart supports the same interpretation. A depth display helps frame those questions, but answering them means combining order-book behavior with price and volume.
Keep the time scale in mind, too. A short-term trader may monitor changes minute to minute, while a longer-term investor may use depth only to understand current trading conditions. In either case, compare like with like: use the same instrument, session, and display settings when reviewing changes. This discipline makes the screen easier to interpret and helps prevent a temporary shift from looking like lasting conviction.
Best bid and offer quotes
The best bid is the highest displayed price a buyer is offering; the best offer, also called the ask, is the lowest displayed price a seller is offering. Together, these quotes show the top of the market for a stock or other instrument. The gap between them is the spread. A narrower spread means the displayed buy and sell prices are closer together; a wider spread means they are farther apart.
How do real-time market quotes differ across U.S. exchanges and trading platforms? A quote may reflect activity at one exchange or combine information from multiple venues. Platforms can also differ in their data sources, update timing, and whether quotes are public, proprietary, or consolidated.
Read both sides before placing an order. If you’re considering a buy, compare your intended price with the current offer; for a sell, compare it with the bid. These displayed prices do not guarantee that an order will execute at that level. Available quantity, changing market conditions, and order type all affect the execution you receive.
Use this short checklist when quotes shift:
- Confirm the symbol and instrument match your intended trade.
- Compare the bid, offer, and spread on the same platform.
- Check the quote’s timestamp and whether it updates during active trading.
- Review displayed size alongside the price, not in isolation.
- Compare the quote with recent trades and the relevant sector’s movement.
A changing spread can add useful context. For example, a stock’s offer may move higher while its bid stays steady, suggesting buyers and sellers are adjusting at different speeds. If both quotes move together, the market may be repricing more broadly. Neither pattern identifies the cause on its own, so compare the quote with relevant news, charts, and trading activity.
Upcoming events can make the top quote especially fluid. Around a company announcement or economic release, buyers and sellers may quickly revise or cancel displayed orders. A quote viewed just before the release may no longer describe the market afterward. Match the timestamp to the moment you’re assessing, and don’t treat a stale screen as a live execution reference.
Public quote displays and proprietary platform feeds may present different views because they can cover different venues or update on different schedules. Compare like with like: use the same instrument, session, and quote type when reviewing platforms. If one screen shows an exchange-specific quote and another offers a broader view, their top prices may not match. Understanding that difference helps you interpret quotes without mistaking a display variation for a trading opportunity.
Where can traders get reliable real-time market data, and what are the costs and delays?
Traders can view market data through exchange displays, broker platforms, and financial news services. The key is understanding what each screen shows: its source, update timing, and whether the quote is live or delayed. Nasdaq indices are displayed publicly with at least a 1-minute delay, although most are updated in real time during market hours. Check the timestamp before treating any screen as current.
“Real-time” can describe different feeds and instruments, not one universal stream. An index display may update differently from an individual stock quote, and a chart may refresh on a different schedule than headlines. For example, compare the timestamp on an index display with the quote for a stock you follow. If they differ, treat each as a separate data point rather than assuming one confirms the other.
Costs depend on the type of data, the instruments covered, the venues included, and the platform’s access model. A public index display and a feed with broader quote or depth information can serve different needs. Match the data to your task: a longer-term view may need less granular updates than active monitoring of quotes and order-book changes. Don’t pay for detail that doesn’t support your approach.
Use this checklist to assess a feed:
- Identify whether the data is real time or delayed, and note its timestamp.
- Confirm which instruments and markets the feed covers.
- Compare the displayed quote with another view of the same instrument.
- Check whether the screen shows quotes, trades, charts, or order-book depth.
- Review the platform’s access terms to understand what affects its cost.
Reliability also depends on how you read the feed. A current quote can change before you place an order, while a delayed chart can make a move appear fresher than it is. Before acting on a headline, compare its publication time with the quote and chart timestamps. If a stock appears to react before the reported event, scrutinize the sequence.
During U.S. market hours, most Nasdaq indices update in real time, while public displays carry at least a 1-minute delay. That distinction matters most when timing is central to your decision. For broader context, compare the index with the specific stock, sector, or instrument you’re tracking, then confirm that the relevant screen reflects the same period.
Build a routine around the data you actually use. Choose a primary screen, record its update status, and compare a second view when prices behave unexpectedly. Note the difference between a delayed overview and a live quote before interpreting a sudden move. To put market movements into a broader visual context, review market charts and analysis.
Phil Stock World: Premium Membership
Phil Stock World’s Premium Membership gives traders access to market commentary, trading ideas, and member content that can help put fast-moving updates in context. Use Market Charts and Analysis to connect price action with broader market activity, or join Educational Webinars to build your understanding of trading strategies. A Virtual Portfolio Review can help you examine how your portfolio relates to the market themes you’re following.
These educational resources can complement your own research; they don’t replace your decisions about what to buy or sell. If you’re looking to deepen your market analysis and explore member resources, visit Phil Stock World.
Turn Market Signals Into a Stronger Process
Build a repeatable routine around information you trust. Decide which updates matter to your strategy, how you’ll assess a move, and what would change your view. A clear process helps prevent a fast headline from turning into an impulsive trade.
A disciplined approach to real-time market updates for traders means using new information to test your thinking, not replace it. Keep a record of the signals you acted on and what happened next. Over time, those notes can help you identify which inputs genuinely support your decisions.
For continued learning, Phil Stock World offers Premium Membership, Virtual Portfolio Review, and Educational Webinars. Explore these resources to strengthen your market perspective and refine how you interpret developments. Contact Phil Stock World to take the next step in your learning.
Frequently Asked Questions
What major economic data releases and company earnings are scheduled today?
The dated earnings schedule available here is for Tuesday, October 20, 2026, not today, October 21. It listed before-market-open estimates for Mercantile Bank Corporation at 1.35 USD, Peoples Bancorp Inc. at 0.93 USD, Commerce Bancshares, Inc. at 1.07 USD, Dime Commercial Bancshares, Inc. at 0.86 USD, Synchrony Financial at 2.42 USD, and Northrop Grumman Corporation at 7.18 USD. Real-time market updates for traders are most useful when matched to the correct calendar date. Use a current calendar for today’s releases.
What breaking news and geopolitical events are affecting markets right now?
Current market-moving headlines require live timestamps. Dated examples include Newsquawk’s October 16 report that WTI crude rose 1.2% after U.S. lawmakers introduced a bill to block a Russia diesel deal, and its October 12 report on Russia-U.S. talks about diesel supply. These are past examples, not confirmation of today’s market drivers. Real-time market updates for traders should pair a fresh headline with the affected instrument’s price response and follow-up reporting.
Which stocks, sectors, and assets are the biggest market movers today, and why?
Reported movers include Apple, up 1.7% after the iPhone Duo sold out minutes after pre-orders opened; WTI crude, up 1.2% after news of a bill to block a Russia diesel deal; and Brent, up 0.8% after Saudi Arabia described a pipeline expansion target. Over one month, Energy Minerals led sectors at +8.53%.