


The clock is part of the trade, not just the chart. Swing trades hold stock positions for 2-10 days, often overnight, while day traders close positions within the same session. This guide to swing trading stocks explains how entries, risk limits, and timing fit together, so you can see what shapes a trade before the buy or sell decision.
It’s easy to focus on finding the perfect entry. But a setup only makes sense when you also define how long you plan to hold the position and how much you’re prepared to risk. A pullback or moving-average signal can help frame a decision, but neither replaces a clear exit plan.
Here, you’ll learn how traders approach pullbacks and moving averages, why broader market direction and chart timeframes matter, and how stops and position sizing help define risk. The goal is a practical framework for understanding how a swing trade takes shape, not a promise that any signal can predict a stock’s next move.
Key Takeaways
- Separate swing trading from day trading by considering whether a position may remain open overnight and how long the setup needs to develop.
- Read pullbacks and moving-average crossovers as signals to assess alongside the broader trend, not as automatic entry instructions.
- Use a defined exit level and position size to make a trade’s potential downside clear before entering.
- Compare daily and shorter-term charts to understand both the market’s direction and the timing of a possible entry or exit.
What Is Swing Trading?
Swing trading holds a stock position for 2-10 days, aiming to capture a price move before the setup changes. This guide to swing trading stocks distinguishes it from day trading, which opens and closes positions within one session, and position trading, where holdings may last weeks or months.
Strategy Rules and Trade Examples
A practical guide to swing trading stocks starts with rules for entry, exit, and acceptable risk. In a hypothetical Stock ZYX bullish flag, the stock rallied from $150 to $185, then broke out at $172 on increased volume. A stop at $167.50 set planned risk at $4.50 per share, with targets at $189.50 and $207. Mapping those levels before entry lets a trader assess potential reward against risk instead of chasing momentum.
Trade Setups, Entries, and Exits
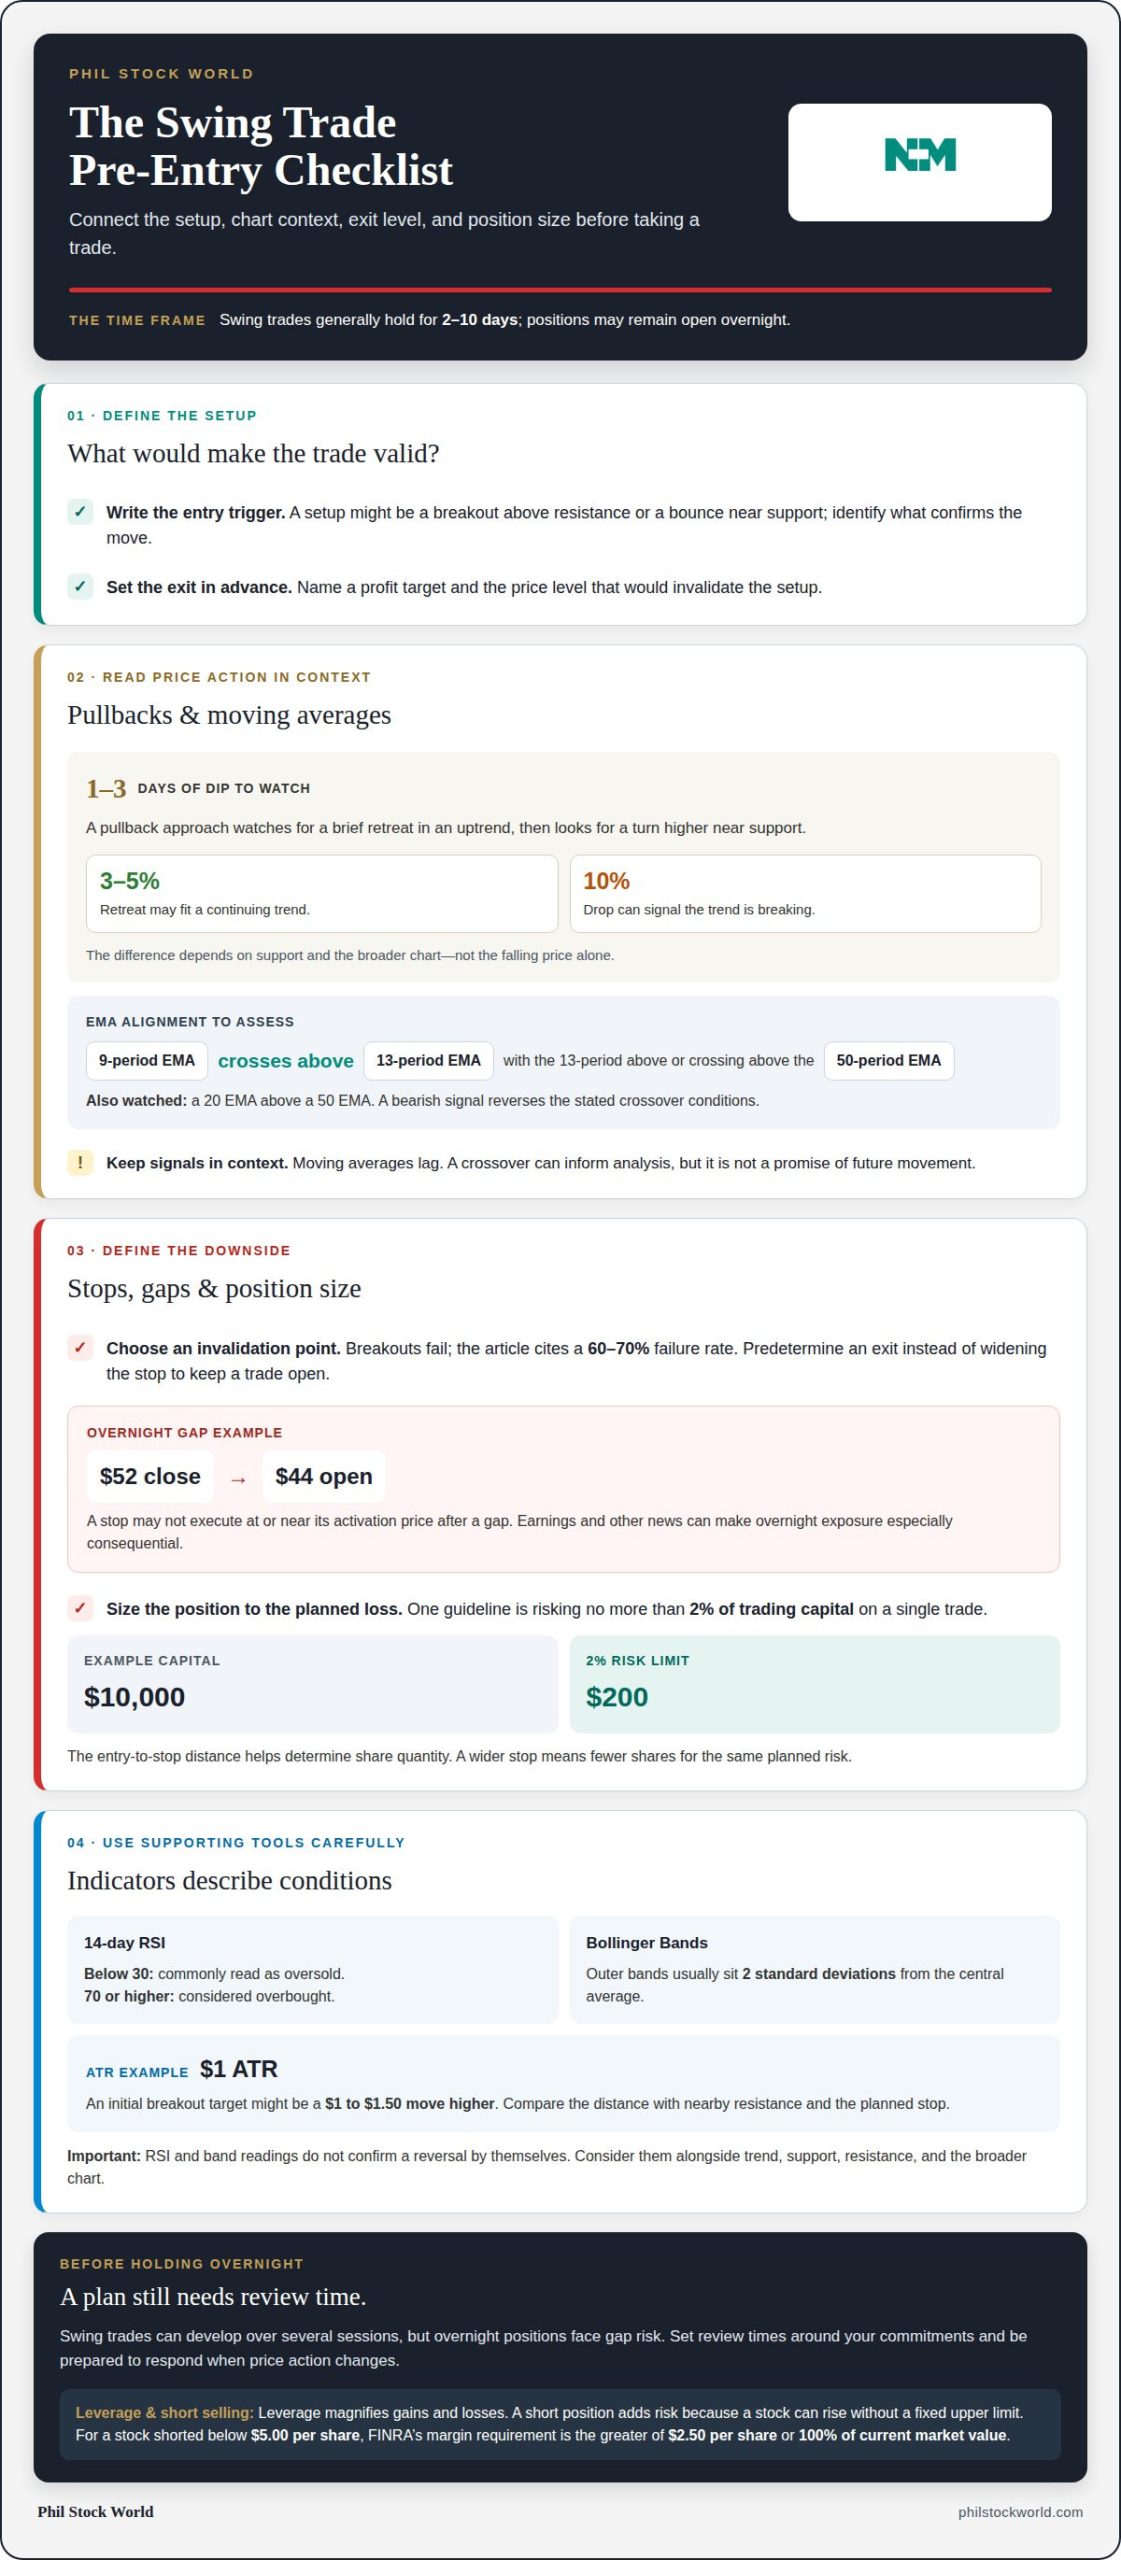
A setup gives a trader a defined reason to consider a position, such as a breakout above resistance or a bounce near support. The entry rule identifies what confirms the move; the exit rule sets a profit target or a level that invalidates the setup. RSI readings of 70 or higher are commonly considered overbought, while readings below 30 are considered oversold. These indicators describe conditions, not guaranteed reversals.
Benefits for Time-Constrained Traders
Because swing trades can develop over several sessions, they may suit traders who can’t monitor every market move throughout the day. A written plan can set review times around work or other commitments. Still, holding overnight exposes a position to gaps when the market reopens. The approach requires time to review open trades and respond when price action changes, even if you aren’t watching the screen constantly.
For U.S. taxes, treatment depends on circumstances such as the account and holding period. Keep trade dates and transaction records organized for reporting.
Commissions, fees, and account requirements depend on the account and trading activity. The pattern day trader rule requires a $25,000 minimum account balance for day trading; simply holding a stock overnight is not day trading.
Pullback buys and moving-average crossovers
A pullback buy looks for price to retreat toward support during an uptrend, then enter after a bounce. One approach watches for a 1-3-day dip before the price turns higher. A 3-5% retreat may fit a continuing trend, while a 10% drop can signal that the trend is breaking. The distinction matters: the same falling price can be a pause or a warning, depending on support and the broader chart.
Moving averages smooth earlier prices, helping traders assess trends across different periods. A basic exponential moving average system uses 9-, 13-, and 50-period EMAs: a bullish signal occurs when the 9-period EMA crosses above the 13-period EMA, with the 13-period EMA above or crossing above the 50-period EMA. A bearish signal reverses those conditions. A 20 EMA above a 50 EMA is another bullish alignment traders may watch. These indicators lag, so treat a crossover as context, not a promise of future movement.
Other technical tools add perspective. A 14-day RSI below 30 is commonly read as oversold, while 70 or higher is considered overbought. Bollinger Bands usually place their outer bands 2 standard deviations from the central average, framing relative price movement. Those readings can help describe conditions, but neither RSI nor a band touch confirms a reversal by itself.
Average true range, or ATR, measures recent price movement and can help frame a target. For a stock with a $1 ATR, an initial breakout target might be a $1 to $1.50 move higher. Traders can compare that distance with nearby resistance and the planned stop before judging whether the setup offers enough potential reward.
Use broader chart context to see how moving averages, momentum, and resistance interact, rather than treating one indicator as a standalone signal.
Risk management and position sizing
Risk planning connects each position’s size to its exit points and the loss you can tolerate. A bullish chart pattern can still fail, so decide what would invalidate your analysis before entering.
Managing Overnight Gap Risk
Overnight gap risk occurs when a stock opens at a different price from its previous close. A stop order may not execute at or near its activation price, so it can’t guarantee an exit at the planned level. For example, a stock closing at $52 and opening at $44 could move past a stop during the market closure. Earnings and other news can make holding through that gap especially consequential.
Handling Pattern Failures
A pattern failure happens when a setup, such as a breakout, reverses instead of continuing in the expected direction. Breakouts fail often enough that the research facts put their failure rate at 60-70%. Volume, support, resistance, and moving averages can inform analysis, but they don’t remove that risk. Predetermine an exit point if price invalidates the setup, rather than widening the stop simply to keep a trade open.
Position Sizing and Risk Tolerance
Position sizing links the number of shares to the amount you’re willing to lose if the stop is reached. One guideline is risking no more than 2% of trading capital on a single trade. With $10,000 in capital, that sets a $200 risk limit. The distance from entry to stop helps determine share quantity; a wider stop means fewer shares for the same planned risk. This makes each position fit a defined tolerance.
Leverage and Risk Management
Leverage increases exposure, magnifying both gains and losses; overnight price moves can accelerate losses. Short selling adds a distinct risk because a stock can rise without a fixed upper limit. For a stock shorted below $5.00 per share, FINRA states the margin requirement is the greater of $2.50 per share or 100 percent of its current market value. Any short position therefore needs careful sizing and a clear exit plan.
Swing trading timeframe and market movements
A swing trade’s timeframe shapes which market movements are relevant. Daily and weekly charts help frame the broader trend; 4-hour or hourly charts can refine entry and exit decisions. Some traders also compare daily, hourly, and 5-minute charts, using each to separate the main direction from shorter-term price noise. The key is alignment: a brief intraday surge carries less weight when the daily trend points lower.
Technical analysis helps describe price action, while fundamental developments can explain why momentum is building or fading. Consider a stock that often rises roughly 5% after positive earnings. If enthusiasm fades about a week later, waiting too long may mean watching potential profit disappear. The example shows why an entry plan should include a time horizon, not just a price target. Volatility, resistance, and the broader trend all affect whether a move has room to continue.
A breakout may produce a 5-15% move within a swing-trading timeframe, but that potential depends on market conditions and the stock’s volatility. Traders can use indicators and chart levels to assess whether momentum is broadening or stalling. If a stock approaches resistance while volume weakens, the expected move may be losing force. If price action remains strong, a planned target can help capture part of the movement without turning an intended swing into an indefinite hold.
Timing also matters within the session. One approach waits for the morning’s trading to settle, then uses 5-minute and hourly charts around 10:30 am-11 am. This can help distinguish early volatility from a more established direction. More frequent swing trades mean more frequent exposure to risk and transaction costs, so activity should serve a clear setup rather than become the strategy itself.
Compare chart signals across timeframes to put potential entries and exits in context with market direction.
Phil Stock World
Phil Stock World helps traders build market context for swing-trade decisions through educational resources and analysis. Its Market Charts and Analysis can help you study trends, momentum, and potential entry or exit levels. Educational Webinars provide another way to deepen your understanding of trading strategies. For a broader view of the available resources, Premium Membership offers access to exclusive content, while a Virtual Portfolio Review can help you examine portfolio positions through a trading-focused lens.
Use these resources when you want to connect chart signals to a clearer trading framework instead of treating each indicator as a stand-alone answer. Swing trading still involves risk, so base decisions on your own plan and risk limits. Explore Phil Stock World’s educational resources to find material that fits your interests.
Make your next trade a deliberate one
Let this guide to swing trading stocks be the starting point for a repeatable decision process, not a script for every market. Before your next position, write down what would make the idea worth taking, what evidence would weaken it, and what you’ll learn if the outcome differs from your plan. That last question turns a trade into useful feedback, not a verdict on your instincts. Focus on the decisions you can control: preparation, consistency, and how you respond when the market surprises you.
If you want to continue the conversation and explore trading ideas from an educational perspective, contact Phil Stock World to discuss trading. Bring the questions you’re considering and the market context you’re following. A thoughtful next step can be simple: keep learning, stay deliberate, and let each decision sharpen your process.
Frequently Asked Questions
How much money do you need to swing trade?
There’s no single capital amount that fits every swing trader. Guidance ranges from $2,000-$5,000 as a usual beginner starting point to at least $5,000, with $10,000 or more offering more room to scale positions. Treat these as different planning estimates, not account rules. The amount you need depends on share prices, your chosen stop distance, position sizing, and the trading costs that apply to your account.
So, what do I look at most across my screens?
Prioritize the market’s direction, the stock’s key price levels, and whether trading activity supports the move. A useful screening sequence is to check the broader market first, compare the stock’s price with nearby support or resistance, then review volume around a potential breakout. This helps distinguish a stock-specific setup from a move that is simply following the market.
Who is it for?
Swing trading may suit someone who wants to make decisions over several trading sessions rather than react to every intraday price change. It still requires a written plan, attention to open positions, and comfort with holding through market closures. Someone who needs predictable outcomes or can’t tolerate short-term losses may find the uncertainty difficult. The fit depends on available attention, risk tolerance, and willingness to follow exit rules.
What is swing trading, and how does it work?
Swing trading aims to capture part of a stock’s price movement by opening a position and closing it as the expected move develops or the setup changes. For example, a trader might watch a stock approach resistance, enter after a confirmed breakout, then exit near a planned target or if price action undermines the idea. The trade depends on its defined conditions, not simply on whether the stock eventually rises.
What technical indicators and chart patterns are commonly used in swing trading?
Traders commonly combine moving averages with momentum tools such as RSI, and patterns such as flags, pullbacks, and breakouts. A stochastic oscillator offers another momentum reading, often calculated over a 14-day window; readings above 80 are commonly viewed as overbought, while readings below 20 suggest oversold conditions. These tools describe different features of price action, so traders often compare them with trend direction and chart levels.
How do swing traders choose stocks and identify entry and exit points?
Traders can screen for stocks with a clear trend, identifiable support or resistance, and enough trading activity to assess a price move. For a breakout, one guideline is to look for volume at least twice the 20-day average. The entry rule defines what confirms the move; the exit plan identifies a profit target or a price level that invalidates the setup. This keeps the decision tied to observable conditions.