


A chart can look decisive while showing only one slice of the market. Learning about market indicators means distinguishing broad readings built from multiple securities from technical indicators, which calculate signals from historical price or volume data for an individual security. The stochastic oscillator, for example, uses a scale from 0 to 100: readings above 80 are generally considered overbought, while readings below 20 are generally considered oversold.
It’s easy to mistake an indicator for a forecast. Instead, treat it as one clue to weigh alongside price action and the wider market picture. This guide explains what market and technical indicators measure, how their signals differ, and what an overbought or oversold stochastic reading may indicate. You’ll gain a clearer framework for interpreting the numbers without treating any single signal as the whole story.
Key Takeaways
- Use technical indicators to interpret an individual security’s price or volume history, not as standalone forecasts.
- Moving averages smooth price data, helping you assess trend direction across different timeframes.
- Market indicators broaden the view by combining data from multiple securities, revealing whether a move has wider participation.
- Read stochastic oscillator signals as clues about momentum, then weigh them alongside price action and the broader market.
What Is a Technical Indicator?
A technical indicator is a mathematical calculation based on historical price or volume data. Moving averages, RSI, MACD, and ADX help traders examine direction, momentum, and trend strength.
Moving Averages and Chart Overlays
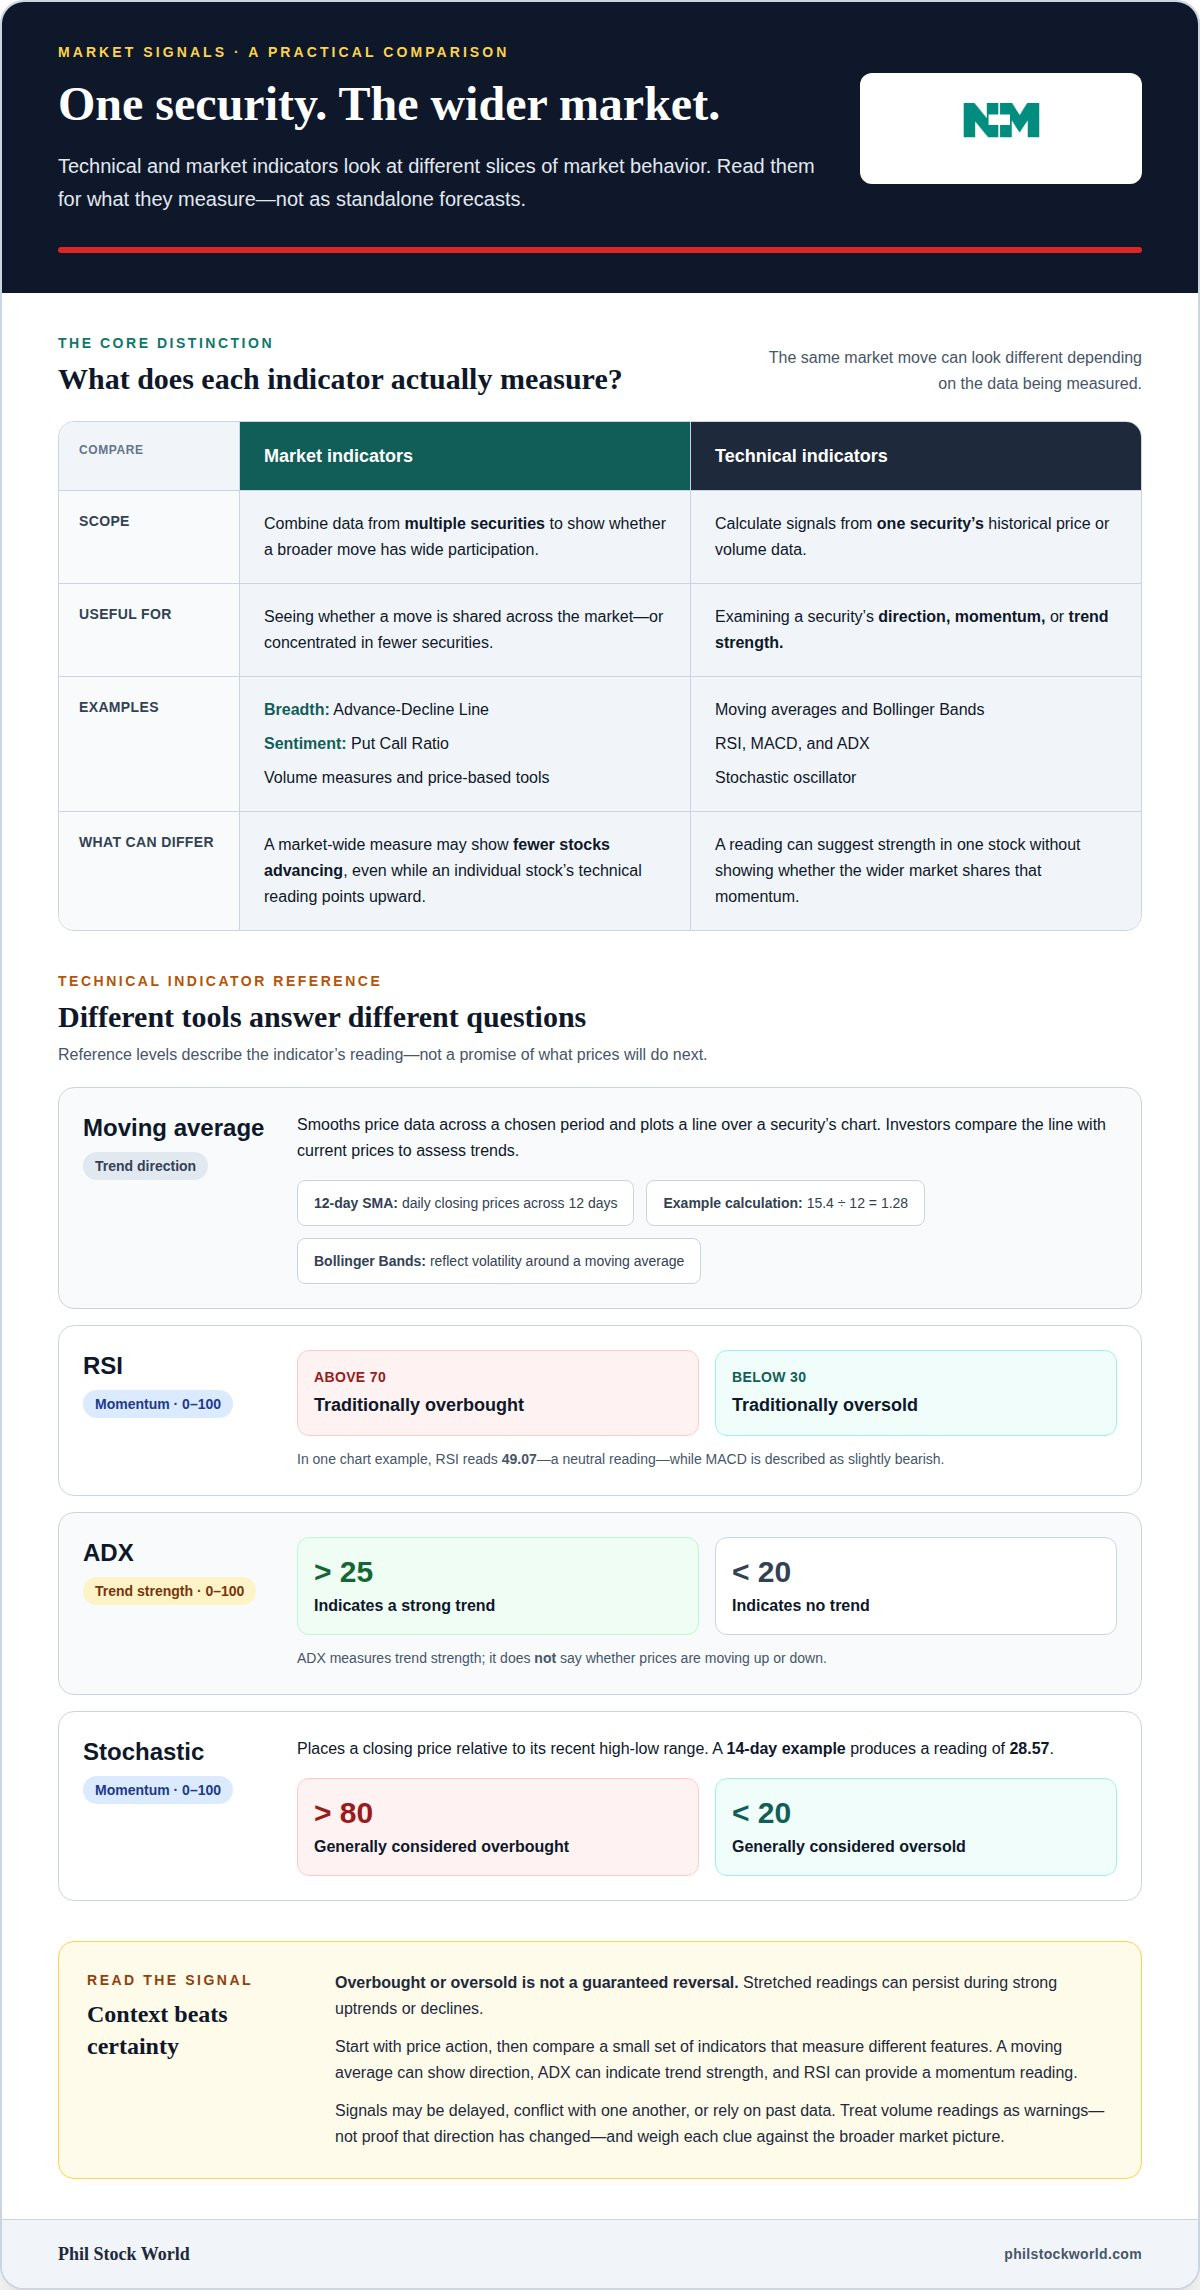
A moving average smooths price data across a chosen period, creating a line plotted over a security’s chart. A 12-day simple moving average uses daily closing prices across 12 days; an example calculation of 15.4 divided by 12 yields 1.28.
Investors use the line to assess trends against current prices, while Bollinger Bands add an overlay that reflects volatility around a moving average. RSI works differently: it measures momentum on a scale from zero to 100, with readings above 70 traditionally considered overbought and below 30 considered oversold.
Chart Patterns and Trading Volume
Chart patterns describe recurring shapes in price action, while trading volume shows how much activity accompanies a move. A breakout above a chart’s resistance area has different context when volume rises than when it fades.
Rising volume can support the prevailing price trend, but volume indicators are warnings, not proof that direction has changed. Beginners can learn to interpret indicators by studying price action over time, then noting whether volume supports a pattern or suggests a more cautious reading.
Trend Strength and Oscillator Examples
The Average Directional Index, or ADX, gauges trend strength on a scale from zero to 100; readings above 25 indicate a strong trend, while readings below 20 indicate no trend. It measures strength, not whether prices are moving up or down.
In one chart example, 50-day and 200-day moving averages sit over price data, while RSI reads 49.07, a neutral reading. The same example describes MACD as slightly bearish. These different signals show why an indicator’s context matters: a neutral oscillator can coexist with a bearish momentum reading.
Combining Indicators to Assess Trends
Investors combine indicators by checking whether price direction, trend strength, and momentum tell a consistent story. For example, a moving average can show direction, ADX can indicate trend strength, and RSI can provide a momentum reading.
Start with price action, then compare a small set of indicators that measure different features. If the average points upward but MACD looks bearish, treat the mismatch as useful context rather than forcing a single conclusion. This keeps the analysis focused instead of stacking signals that repeat the same information.
How market indicators differ from technical indicators
Technical indicators calculate signals from one security’s historical price or volume data. Market indicators combine data from multiple securities to show whether a broader move has wide participation. For example, a stock’s technical reading may point upward while a market-wide measure shows fewer stocks advancing.
Leading indicators aim to signal a possible change before it appears broadly; lagging indicators confirm movement after it develops. Coincident indicators describe conditions unfolding at roughly the same time. These labels describe timing, not certainty. An indicator’s role depends on the data it measures and how traders use it.
Common limitations include delayed readings, conflicting signals, and calculations based on past data rather than future events. A technical indicator can suggest strength in one stock without showing whether the wider market shares that momentum. Treating one reading as a complete forecast can obscure the difference between a security-specific move and a broad market shift.
Technical analysis studies price behavior and trading activity, while fundamental analysis examines factors such as a company’s business and financial condition. These approaches answer different questions: technical analysis describes market behavior, while fundamental analysis considers what may influence a business’s value. Investors can weigh both without assuming either provides a complete forecast.
Empirical work has tested whether technical patterns contain useful information. Lo, Wang, and Mamaysky examined daily stock returns from the New York Stock Exchange and NASDAQ from 1962 to 1996. Another study reported excess returns from head-and-shoulders patterns in four currency markets between 1973 and 1994; a separate evaluation examined William Hamilton’s Dow Theory predictions from 1901 to 1929.
For up-to-date U.S. readings, use charts that display the underlying series and calculation settings, so you can interpret changes in context. Market charts and analysis offer a way to examine plotted market signals alongside one another.
Technical analysis is common in commodities and forex markets, where traders focus on short-term price movements. Treat technical volume indicators as warnings, not as proof that a trend has changed direction.
Stochastic oscillator and overbought or oversold readings
Common types of market indicators include breadth measures, sentiment readings, volume measures, and price-based tools. The Advance-Decline Line tracks advancing stocks against declining stocks, while the Put Call Ratio compares put and call options. These tools describe different aspects of market activity. Oscillators such as the stochastic indicator instead assess momentum in a security’s price movements.
The stochastic oscillator places a closing price relative to its recent high-low range, using a scale from 0 to 100. A 14-day example produces a reading of 28.57. Readings above 80 are generally considered overbought, and readings below 20 oversold. These zones flag stretched momentum, not a guaranteed reversal or a prediction of the next move.
That distinction matters: an overbought reading can persist during a strong uptrend, just as an oversold reading can last during a decline. Read the oscillator alongside the price chart and its direction. If price keeps making higher highs while the oscillator weakens, momentum may be fading. The signal suggests caution, but it doesn’t predict a precise turning point.
RSI also measures relative strength and momentum, while MACD compares moving averages to show changes in momentum. The McClellan Oscillator is another market indicator. Together, these tools offer distinct lenses on price and participation. In investing, compare their messages with observed price action rather than treating several oscillator readings as independent proof.
Commonly used indicators include the Advance-Decline Line, Put Call Ratio, stochastic oscillator, RSI, MACD, and McClellan Oscillator. They measure different aspects of market activity, including breadth, sentiment, and price momentum.
Other price references can sit alongside these momentum readings. Common Fibonacci retracement levels include 50%. That level can be considered as another reference when reviewing price action, rather than as confirmation by itself. The MACD crossing above the zero line is considered bullish. Read together with the stochastic oscillator, this offers a way to compare a momentum reading with another indicator signal; it still does not establish that price must reverse or continue. The emphasis remains on treating indicators as context, not certainty.
Definition and purpose of market indicators
Learning about market indicators starts with understanding how they turn data from stocks, indexes, trading activity, or economic conditions into signals about broader market behavior. Rather than describing one company alone, they help investors assess participation, direction, sentiment, and changing conditions across a market. Hundreds of indicators cover indexes in the United States and around the world, each highlighting different aspects.
Their purpose is to add context to price movements. Market breadth indicators compare how many stocks move in the same direction as a larger trend; the percentage trading above a 50-day or 200-day moving average can show whether an index’s advance has broad participation. A divergence between an index rising and fewer stocks joining the move can suggest weakening participation, not an automatic reversal.
New highs and new lows offer another perspective. A large number of stocks reaching new highs may signal a frothy market, while many new lows may suggest the market is bottoming. These readings show how individual stocks are moving beneath an index’s headline performance. That distinction matters: a rising index can hide uneven strength among its constituents.
Economic indicators influence markets by changing expectations about growth, inflation, employment, and interest rates. As conditions develop, investors may reassess company prospects and the appeal of different assets. The market response depends not only on the direction of a release, but also on how it compares with expectations and what other signals show.
Learning about market indicators also means using a reading to frame a question, then comparing it with price action and participation. For example, if an index rises while the number of stocks above their moving averages falls, that divergence is a reason to examine the rally’s breadth more closely. It provides context, not a forecast on its own.
To put these signals in context, explore market charts and analysis that bring broad market readings together with price movements.
Phil Stock World: Market Charts and Analysis
Phil Stock World’s Market Charts and Analysis can help you examine indicator readings alongside broader market context. Turn to these resources when a signal looks mixed or you want to understand how individual stocks fit into a wider trend. Premium Membership offers access to exclusive content, while Educational Webinars provide another way to build familiarity with market concepts. A Virtual Portfolio Review can help you discuss how portfolio positions relate to the signals you’re studying. These offerings support market education and analysis, not direct asset management, brokerage services, or personalized financial planning. If you’d like to explore how Phil Stock World can support your market research, contact Phil Stock World.
Build a Process You Can Keep Using
Learning about market indicators becomes more useful when each signal has a clear role in your decision-making. Instead of chasing a fresh reading every time prices shift, develop a consistent way to record what you observed, what other evidence supported it, and what would change your view. You’ll have a record to revisit when the market mood changes.
The next step is turning market education into a repeatable practice. Phil Stock World offers resources including Premium Membership, Virtual Portfolio Review, and Educational Webinars to support continued learning and portfolio discussion. Choose the format that fits the questions you’re exploring, then keep refining how you interpret market information.
Ready to take that next step? Contact Phil Stock World and keep building confidence in your market research, one considered decision at a time.
Frequently Asked Questions
What are Market Indicators?
Market indicators help describe conditions across financial markets, such as participation, sentiment, or volatility. For example, an investor reviewing a broad index can compare its movement with the number of stocks advancing and declining. This perspective helps distinguish an index move supported by many stocks from one carried by a narrower group.
What are trading indicators?
Trading indicators are calculated measures traders use to examine price behavior, volume, or momentum when assessing a potential trade. A trader might use a moving average to frame the trend, then consider whether a momentum reading supports the same view. Their practical value lies in building a consistent decision framework, not treating an indicator as an instruction to buy or sell.