


Trading strategies for different market conditions start with a systematic plan: rules for what to trade, when to enter and exit, and how to manage risk. The strategy should fit the market in front of you. A trend-following approach can struggle when prices move sideways, while a range strategy can falter when a trend takes hold. Market conditions shift, so your rules should account for that.
It’s natural to want one reliable setup, but adapting a strategy doesn’t mean changing course every time prices twitch. It means identifying whether the market is trending, ranging, or unusually volatile, then applying rules tested for those conditions. This guide explains what makes a trading strategy, how to build and backtest one, and how to adjust position size, stops, and exits as volatility changes. You’ll also learn to assess the broader market context, so decisions rely on a process rather than a hunch.
Key Takeaways
- Classify the market as trending, ranging, or volatile before choosing an approach; a strategy suited to one regime may struggle in another.
- Turn your trading idea into clear entry, exit, and risk rules, then test it across different market conditions before using real money.
- As volatility shifts, reassess stop placement and position size together so a wider stop doesn’t quietly increase the amount at risk.
- Use market charts and analysis to evaluate the broader trend, sentiment, and potential catalysts before adapting your plan.
What Is a Trading Strategy?
A trading strategy is a systematic plan with predefined rules for buying and selling securities. It specifies which trades to consider, when to enter and exit, and how to manage risk, with rules suited to changing market conditions.
-
Recognize the Current Market Regime
Classify the market as trending, ranging, or volatile before choosing an entry. An uptrend shows prices rising consistently; a downtrend shows consistent declines. Ranging markets oscillate between support and resistance without a sustained direction. High volatility brings sharp, rapid moves. In low-volatility conditions, favor range-bound setups, tighten stops, and skip forced trades. Trend systems can whipsaw in ranges, while mean-reversion strategies may struggle against strong trends. Breakout entries can fail when prices don’t hold beyond a boundary.
-
Filter Stock Trades with Market Breadth
Check market breadth alongside a broad index trend before acting on an individual stock. For a long swing trade, one possible filter is more than 50% of stocks trading above their 50-day moving average. Compare that reading with the index’s direction: an advancing index and broad participation can support long setups, but don’t guarantee success. If the index weakens while a candidate stock rallies, lower your conviction or wait. This top-down step helps traders distinguish a stock-specific move from wider market strength and frame bullish or bearish trades accordingly.
-
Apply Moving Averages to Trend Analysis
Use moving averages to assess direction, not as standalone trade signals. A short-term moving average crossing above or below a long-term average can flag a potential trend shift; MACD indicators can help assess momentum and strength. In bullish markets, trend-followers may buy pullbacks to support and use trailing stops. In bearish markets, they can wait for pullbacks to resistance before considering short entries. No indicator can guarantee profitable trades. According to the European Securities and Markets Authority (ESMA), 74% to 89% of retail CFD accounts lose money, underscoring why rules and risk limits matter.
Building and backtesting a trading strategy
Turn your market view into rules you can test, then examine how they perform under different conditions. A disciplined process helps distinguish a repeatable edge from a chart that only looks promising.
-
Build a Trading Strategy
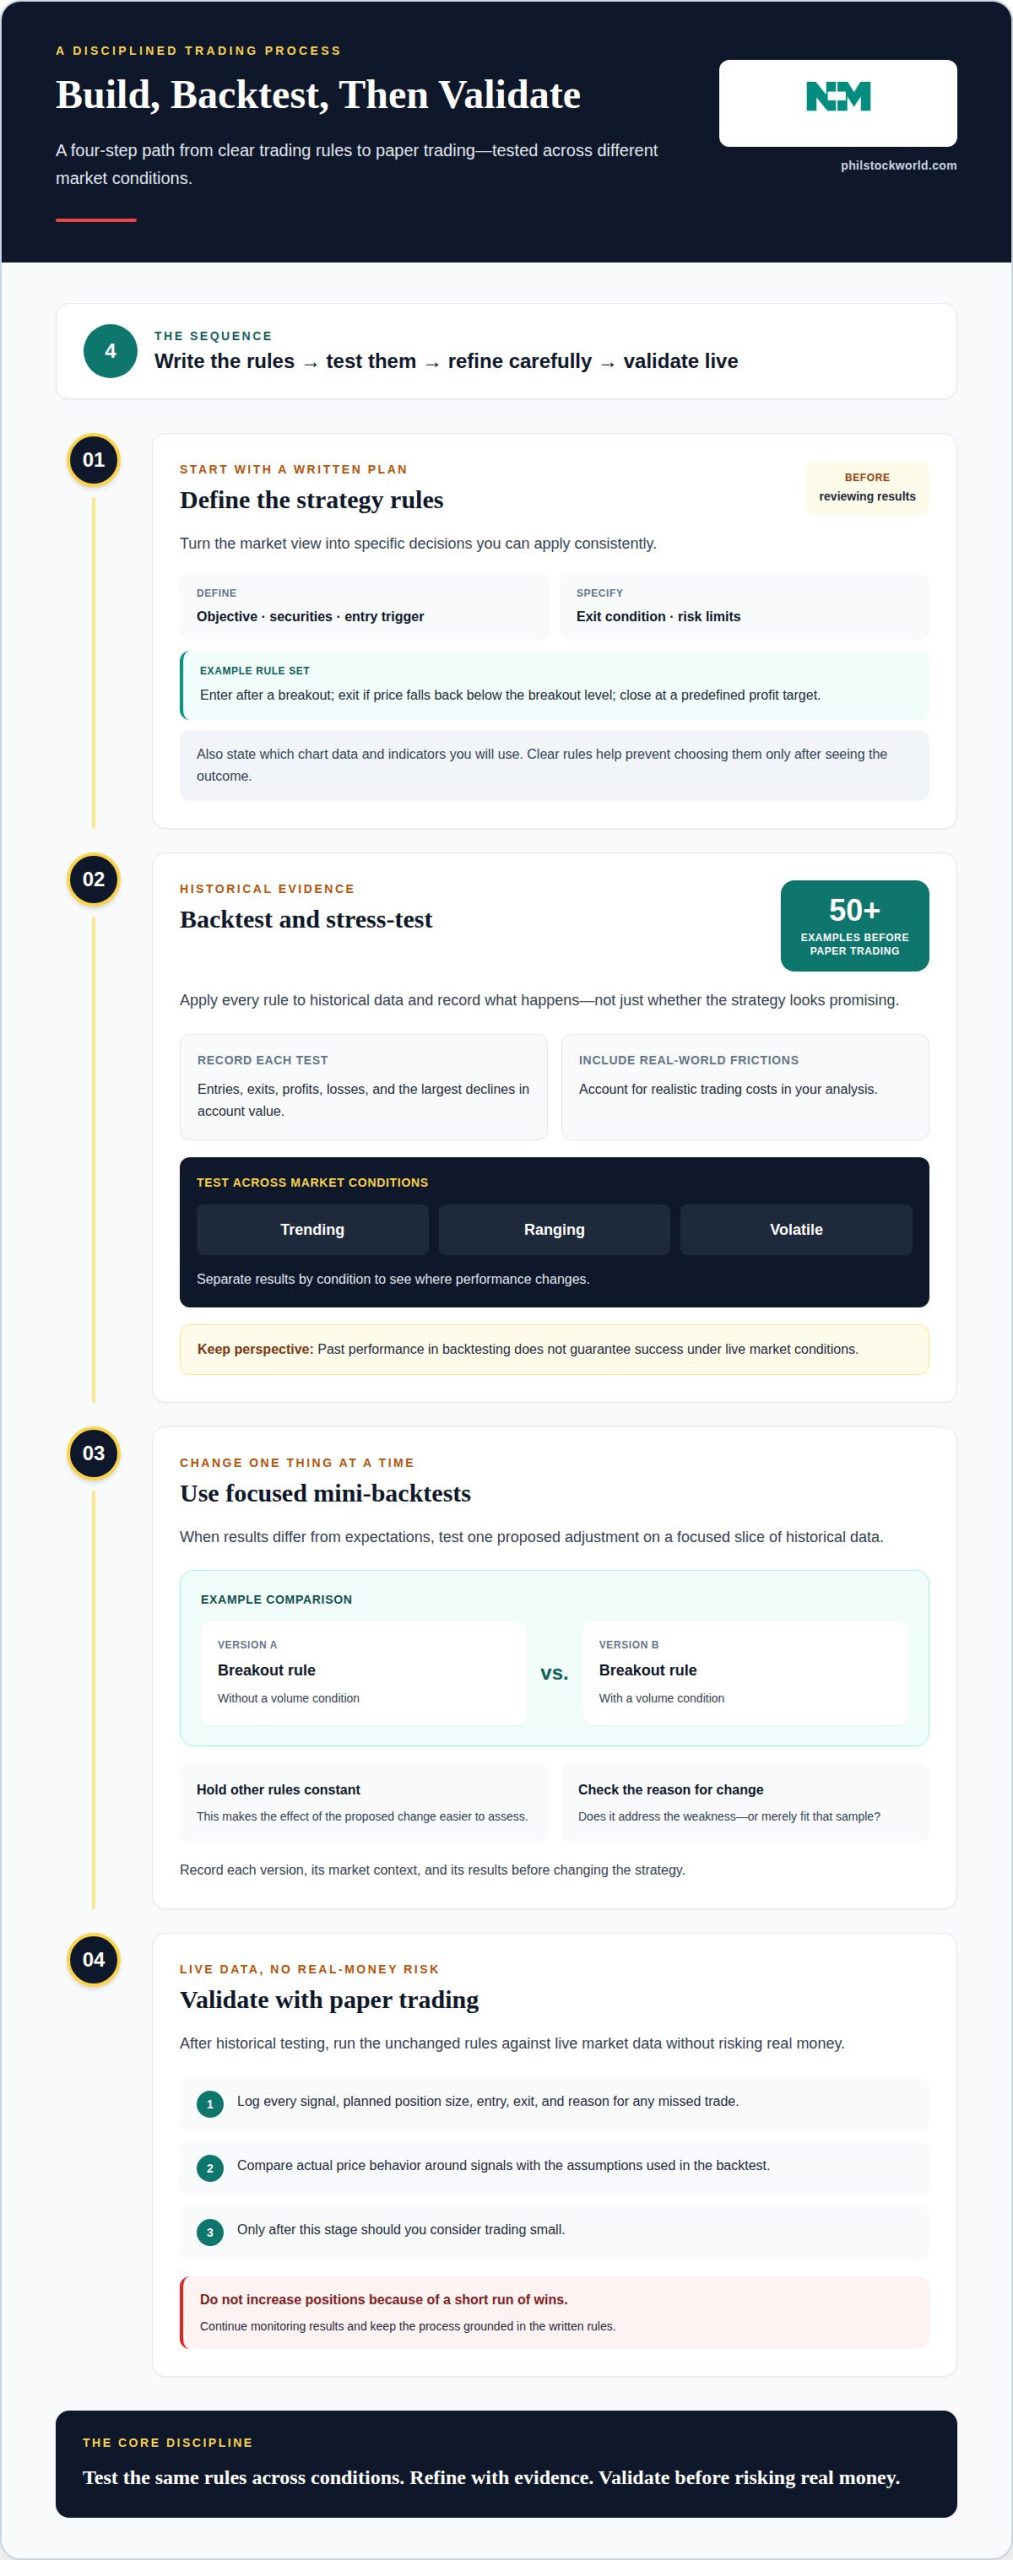
Define your objective, tradable securities, entry trigger, exit condition, and risk limits before reviewing results. For example, a plan might enter after a breakout, exit if the price falls back below the breakout level, and close at a predefined profit target. Specify the chart data and indicators you’ll use, too. Clear rules help you evaluate the strategy consistently instead of choosing rules after seeing the outcome.
-
Backtest and Stress-Test the Strategy
Apply every rule to historical data, recording entries, exits, profit, losses, and the largest declines in account value. Test at least 50 examples before paper trading, then separate results by market condition. Stress-test the same rules during trends, ranges, and volatile periods to see where performance changes. Include realistic trading costs in your analysis. Past performance in backtesting doesn’t guarantee success under live market conditions.
-
Use Mini-Backtests to Adapt
When results diverge from expectations, test one proposed adjustment against a focused slice of historical data. For example, compare a breakout rule with and without a volume condition while keeping the other rules constant. Check whether the change addresses the intended weakness or merely fits that sample. Record each version, its market context, and its results before changing the strategy.
-
Validate with Paper Trading
After historical testing, run the unchanged rules against live market data without risking real money. Log each signal, planned position size, entry, exit, and reason for any missed trade. Compare actual price behavior around your signals with the assumptions in your backtest. Only after this stage should you consider trading small. Keep monitoring results, and don’t increase positions because of a short run of wins.
Position sizing and stop placement as volatility changes
In high-volatility markets, adjust position size and stop placement together. Use Average True Range (ATR) to gauge price swings, then reduce exposure when a wider stop is needed.
-
Assess Volatility and Market Shifts
Compare current ATR with recent readings to see whether a stock’s typical price range is expanding. If swings increase, a stop placed too close may be triggered by ordinary price movement. A wider stop, however, increases potential loss per share. Adjust position size to keep planned risk per trade consistent. For long-term positions, assess whether the broader trend has changed rather than reacting to a single volatile session.
- Set the stop where your trading idea is invalidated, then calculate position size from that distance. For example, if a technical setup requires a wider stop in a fast market, hold fewer shares to limit the amount at risk. The research guidance describes risking 0.5% or less per trade after backtesting and paper trading. Treat that as a risk-management framework, not a reason to ignore the stop or increase exposure.
-
Monitor and Adjust Positions
After entering a trade, monitor price action, ATR, and relevant news for changes that affect the original setup. If a sharp move changes the market’s direction, consider whether your rules call for exiting early or scaling out to take partial profits. Don’t move a stop farther away just to avoid realizing a loss; that increases risk after entry. Record each adjustment and its reason so later analysis can distinguish a planned response from an emotional one.
Adapting trading strategies to overall market conditions
Apply tested rules to the market’s broader behavior, not every short-lived price swing. A useful process combines trend signals, economic context, sentiment, and risk management.
- Start with a top-down market read. Compare longer-term, intermediate, and daily trends to see whether they point in the same direction. If the S&P 500 rises while participation weakens, treat bullish signals in individual stocks more cautiously. In a downtrend, avoid trying to catch falling prices; wait for a pullback toward resistance before considering a short setup. Let the broader trend shape your bias, not dictate every entry.
- Match the strategy to observed price behavior. A steady directional move may suit trend-following or breakout rules, while repeated reversals between support and resistance may suit mean reversion. RSI and the Stochastic Oscillator can help assess overbought or oversold conditions in a range, but those readings aren’t a reason to trade on their own. Define when a setup is valid and what change in conditions cancels it.
- Note economic catalysts before opening a position. GDP growth, employment figures, inflation releases, and central bank decisions can shift sentiment and increase volatility. If you don’t trade major reports directly, wait for the initial reaction to settle, then assess whether price still supports your setup. Optimism can fuel buying pressure, while pessimism can intensify selling. Extreme bullish or bearish sentiment may also precede a reversal, so don’t treat consensus as confirmation.
- Review signals together rather than letting one indicator run the show. Check whether price direction, market breadth, volume, and the economic backdrop support the same thesis. A high-volume move can reinforce a trend, while a low-volume move may be less convincing. If conditions change suddenly, use your risk-management rules to exit early or scale out. To bring broader context into your review, review market charts and analysis alongside your trade signals.
Phil Stock World: Market Charts and Analysis
Phil Stock World’s Market Charts and Analysis can help you consider price action alongside the broader market context. Use these resources when reviewing whether a strategy still fits current trends or when you want more context before adjusting a watchlist or trade thesis.
Phil Stock World’s Premium Membership includes exclusive content such as top trades and sector-specific insights. Educational Webinars offer a way to explore strategy concepts, while a Virtual Portfolio Review can help you examine portfolio positions in relation to your trading approach. These resources support your own research and decision-making; they don’t place trades for you.
If you’d like to explore how Phil Stock World’s market resources can support your process, contact Phil Stock World.
Make Your Next Trade a Process, Not a Prediction
Markets keep changing, so build a routine you can repeat. Before your next trade, write down what would confirm your setup, what would invalidate it, and what market change would make you stand aside. That habit turns trading strategies for different market conditions into a practical framework, rather than a series of reactions to headlines or sharp price moves.
Keep a concise trading journal, too. Record the market context, your decision, and whether you followed your rules. Over time, these notes can reveal where your process needs refinement and which conditions call for more caution. The goal isn’t to predict every turn correctly. It’s to make deliberate decisions and preserve your ability to keep learning.
If you’re ready to discuss your next steps, contact Phil Stock World. Keep refining the process, stay curious, and let each trade teach you something useful.
Frequently Asked Questions
What are the main market conditions traders should identify?
Distinguish directional trends, sideways ranges, and sharp, volatile markets. Also watch for transitions: a breakout from a range, for example, may start a trend or turn out to be a brief failed move. Compare price behavior across timeframes, then wait for evidence that your strategy fits the current conditions before acting.
Which trading strategies work best in trending markets?
Trend-following and momentum strategies aim to participate in sustained directional moves. Traders can use a moving average crossover or MACD to assess direction and momentum, then look for an entry that follows tested rules. Volume adds context: stronger volume alongside a price move may support the trend, while a low-volume move calls for caution. Define an exit before entering.
What strategies are effective in range-bound or sideways markets?
Range traders can plan entries near support and exits near resistance, while oscillators such as RSI or the Stochastic Oscillator can help assess whether price may be stretched. Avoid chasing a move in the middle of the range, where direction may be unclear. If price breaks a boundary, reassess the setup instead of assuming the old range still holds.
How should traders adjust strategies in bull and bear markets?
In a bull market, traders can prioritize long setups that align with rising prices while defining what would invalidate each trade. In a bear market, they can focus on short setups that fit falling prices rather than buying simply because an asset has declined. A broad index can help frame the backdrop, but an individual stock may behave differently from the wider market.
How do interest rates, inflation, and economic data affect trading strategies?
Interest-rate decisions, inflation readings, and economic releases can shift sentiment and trigger abrupt price moves. Before a scheduled announcement, decide whether your strategy is designed to trade the event or avoid its immediate volatility. For a stock setup, account for company earnings as well as broader economic news before deciding whether the signal still fits.
What indicators help identify market regimes and confirm entries?
Moving averages can help show direction, while MACD can help assess momentum. Volatility indexes offer another view of market conditions, and an economic calendar highlights scheduled catalysts that may affect price behavior. Combine indicators with price structure, such as a breakout or support test, and follow defined rules. No single signal guarantees a profitable trade.