
July Seasonally Adjusted Retail Sales "Mixed Bag"; Manufacturing Output Rises Led by Auto Sector
Courtesy of Mish
Excluding autos and gas retail sales ran out of steam in July 2010. Please consider the SpendingPulse Report July Retail Sales Show Mixed Results.
After several months of sales slowdown, total retail sales have stabilized somewhat, although overall growth has slowed sharply since earlier this year. In fact, growth in July headline numbers was driven largely by an increase in spending on gasoline, which is why the ex-auto ex-gasoline number is a better barometer to measuring the underlying health in retail spending.
July’s growth rate excluding auto and gasoline leaves the three-month average year-to-year growth rate of retail sales at 1.0%, well below the 3.5% for the prior three months. The ex-auto year-over-year numbers tell a similar story of a shallow and stabilizing trough, with the unadjusted three-month average year-over-year growth rate slowing to 1.6% compared to the 6.5% average growth rate for the previous three months.
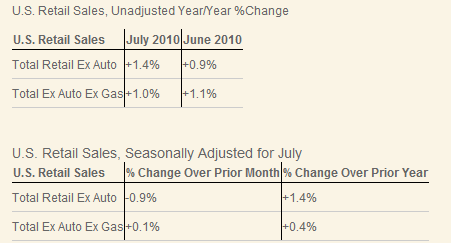
The first table above compares June and July 2010 vs. the same month in 2009.
The second table shows July 201o vs. June 2010 seasonally adjusted. For an alleged recovery, these are weak numbers.
Industrial Production up 1 Percent, Led by Autos
Inquiring minds are taking a look at the July Federal Reserve Industrial Production and Capacity Utilization report.
Industrial production rose 1.0 percent in July after having edged down 0.1 percent in June, and manufacturing output moved up 1.1 percent in July after having fallen 0.5 percent in June. A large contributor to the jump in manufacturing output in July was an increase of nearly 10 percent in the production of motor vehicles and parts; even so, manufacturing production excluding motor vehicles and parts advanced 0.6 percent.
The production of consumer goods moved up 1.1 percent, as the output of consumer durables jumped 4.9 percent: Production for all of its major components advanced. In addition to a gain of 8.8 percent in the output of automotive products, which was mainly due to a large increase in light truck assemblies, the indexes for home electronics and for miscellaneous goods increased 1.3 and 1.5 percent, respectively; the index for appliances, furniture, and carpeting moved up 0.5 percent.
Among components of consumer nondurables, the output of non-energy nondurables declined 0.2 percent, and the output of consumer energy products moved up 0.7 percent. Within non-energy nondurables, the output both of foods and tobacco and of clothing fell, while the indexes for consumer chemicals and paper products increased.
Industrial Production Perspective
Before anyone gets too excited by these numbers let’s take a look at where we are vs. pre-recession and vs. 1999.

click on chart for sharper image
Manufacturing is not yet back at 1999 levels while overall industrial production is barely there.
Will Sales Keep Up?
The strength in the auto sector noted by the Fed mirrors the MasterCard report. Looking ahead, not just pertaining to autos, production is up, but will sales match?
Given weakening economic indicators across the board, especially housing, I rather doubt it.
The next few months may be quite telling.