
Rick’s updated economic charts are less than encouraging – consumer demand is not improving, nor is the recession over as measured by consumer demand for discretionary durable goods. But Rick would argue against a simple Great Recovery and possible a double dip, in favor of a continuation of the original, complex "dip" – The Great Recession. – Ilene
Consumer Metrics Institute News: September 1, 2010 – Viewing the "Great Recession" in Hi-Def
Courtesy of Rick Davis at Consumer Metrics Institute
The "Great Recession" that began in 2008 has had many nuances, some of which can only be seen in data with higher resolution than that provided by the BEA or NBER. Our day-by-day profile of consumer demand helps us understand triggering events while also making it clear that many recent changes in consumer behavior have begun to linger — much as the recession itself now appears to have done.
We have previously reported that consumer demand for discretionary durable goods is now at recessionary levels after starting to contract on a year-over-year basis on January 15, 2010. On the surface this would indicate a "double-dip" recession following the 2008 economic event. We may have inadvertently promoted the "double-dip" aspect of 2010’s contraction by often graphing the two events superimposed upon each other in our "Contraction Watch" chart — as though they were independent episodes:

(Click on chart for fuller resolution)
But to even a casual observer there is something unsettling in the above chart, especially if we’ve been told that the "Great Recession" was a once-in-a-lifetime event that required once-in-a-lifetime amounts of new national debt to fix. Clearly, the 2010 contraction already appears well on the way to equaling or exceeding the "Great Recession" in severity despite those "fixes."
By the end of August, the 2010 contraction had out-lasted the "Great Recession" in duration, and was contracting at a rate that we might expect to see only once in every 15 years. But it is highly unlikely that two fully independent contractions this severe would happen only two years apart — just as the 1937 recession is not generally thought to be just another closely spaced severe recession, but is rather seen in the proper context.
Perhaps we need to take a look at our longer term charts, including our 48 months of Weighted Composite Index data (a nominal base 100 index where 100 = zero net year-over-year change):
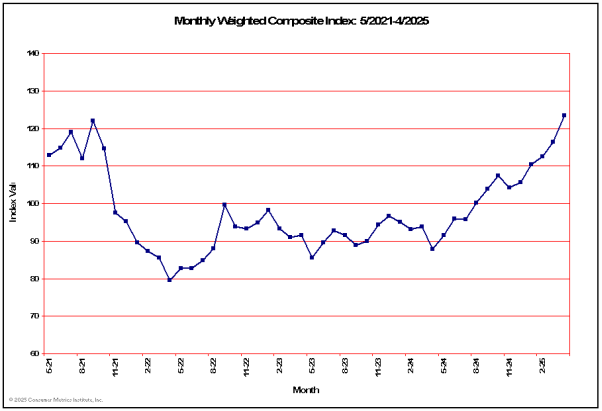
From this perspective, we might reasonably ask whether the upward bump that reached a daily peak on August 12, 2009 is a "Great Recovery" or merely a stimulus fueled anomaly within a longer term economic slowdown. If the latter is true, then the shape of the 2010 contraction in our "Contraction Watch" chart makes more sense; we might be seeing now how the 2008 event would have progressed without generous doses of short term consumer stimuli during 2009 (e.g., "Cash for Clunkers" and the Federal Housing Tax Credit).
Our data also indicates that the "Great Recession" unfolded for consumers differently than National Bureau of Economic Research ("NBER") might have us believe. The NBER is considered to be the official scorekeeper for recessions, and they have dated the beginning of the "Great Recession" to December 2007. While it is true that consumer demand (as measured by our Daily Growth Index) peaked prior to that month (on July 28, 2007 to be exact), we find that during December 2007 consumer demand was still growing year-over-year by more than 1% — slow growth perhaps, but hardly a recession. In fact, on December 13, 2007 some sectors of consumer demand were almost giddy in their growth: housing was still growing at a 12.8% year-over-year rate while our retail department chain index was up double digits. Consumers were clearly not yet in any major funk.
By May 26, 2008 — nearly two quarters after the NBER claims we were already in a recession — consumer demand for discretionary durable goods had finally slipped into year-over-year net contraction. By that time the consumer climate had changed: crude oil was topping $130 per barrel and the collapse of Bear Stearns was in the nightly news. Additionally, in the U.S. the presidential primaries were in full swing, bringing with them unprecedented political uncertainty. When the timing of consumer behavior changes is better understood, the triggering events can be more readily identified. By May 2008 consumers had good reasons to be cautious about big-ticket discretionary expenditures — reasons that simply had not existed six months earlier.
Similarly, the lowest levels of consumer demand we have ever recorded occurred on November 5, 2008 while the entire nation reflected on the results from the preceding day’s elections. That was followed by an organic rebound in demand that brought the entire consumer economy into net growth by early January 2009, long before any major fiscal stimulus had reached the streets. The consumer climate had once again changed: oil was $33 per barrel and the election was behind us. Again, higher resolution data can help sort out cause and effect, making policy responses better timed and targeted.
Economic cycles are complex and economic cause-effect relationships can often be ambiguous. In May, 2008 unemployment was still only 5.4%, and the downturn that we monitored in consumer demand preceded and plausibly caused at least a portion of the subsequent rise in joblessness. Now, over two years later, the cause-effect relationship has at least been muddled and arguably flipped: on the one hand we have observed high unemployment levels persisting throughout the artificially stimulated "green shoots"; while on the other hand we see in our daily data that rising unemployment concerns inversely correlate with dropping overall consumer demand for discretionary durable goods. Unfortunately this means that unemployment has remained sticky in the face of positive stimuli while discretionary consumer demand remains free to float down on bad news or increased uncertainties.
Contrary to the timeline suggested by the NBER, our data strongly suggests that the consumer portion of this recession did not start out to be about housing or damaged consumer balance sheets. But it is now. It has clearly evolved, and the average consumer’s version of a recession diary might look something like this:
- December, 2007: Spending slightly more than last year, sub-prime mess is somebody else’s problem
- May, 2008: Gas prices way up, banking crisis in the news — maybe we need to be little cautious
- August, 2008: Democratic National Convention says things really are getting different this time, maybe more caution is warranted
- November, 2008: Good, the election’s over, and gas prices are down — things are getting normal again
- March, 2009: The 401K may be hurting, but at least we have the house to retire on
- June, 2009: Unemployment numbers don’t look good, but those usually start back down
- August, 2009: A lot of vacant houses in the neighborhood, let’s rethink retirement funding
- January, 2010: Unemployment is getting worse, let’s pay down our credit cards
- May, 2010: There may be a recovery going on somewhere else, but it certainly ain’t here
- August, 2010: Politics are getting ugly again, things aren’t about to improve anytime soon
There probably hasn’t been two separate recessions in three years, simply one that has evolved in significant ways. But if this really is a "double dip" recession, then our data indicates that the "Great Recession" of 2008 was merely the precursor, and not the main event. It is this current dip that we should be really concerned about; the current contraction in consumer demand is about structural changes in consumer behavior, whereas the "first dip" was about short term loss of consumer confidence.
This recession has been complex and constantly evolving in ways that policy makers have not been able to understand through their low resolution lenses. As a consequence their policy responses have been misguided, ineffective and wasteful. The Federal Reserve may be able to save the banking system by being the "lender of last resort", but it is powerless to change perhaps the one thing that John Maynard Keynes got right — and what he mischaracterized as a "Paradox of Thrift" — as over 100 million U.S. households become economic "loose cannons", acting exclusively in their own best interests in 100 million different ways.
At the Consumer Metrics Institute we measure day-by-day changes in the discretionary durable goods transactions of internet shopping consumers. We genuinely believe that the real economy lives where "Main Street" consumers are (figuratively and/or literally) clicking "Add to Shopping Cart", not where the BEA’s surveyed factories slavishly follow the consumer’s lead.