

 Goooooooaaaaaaaaaaaaaaaal!!!
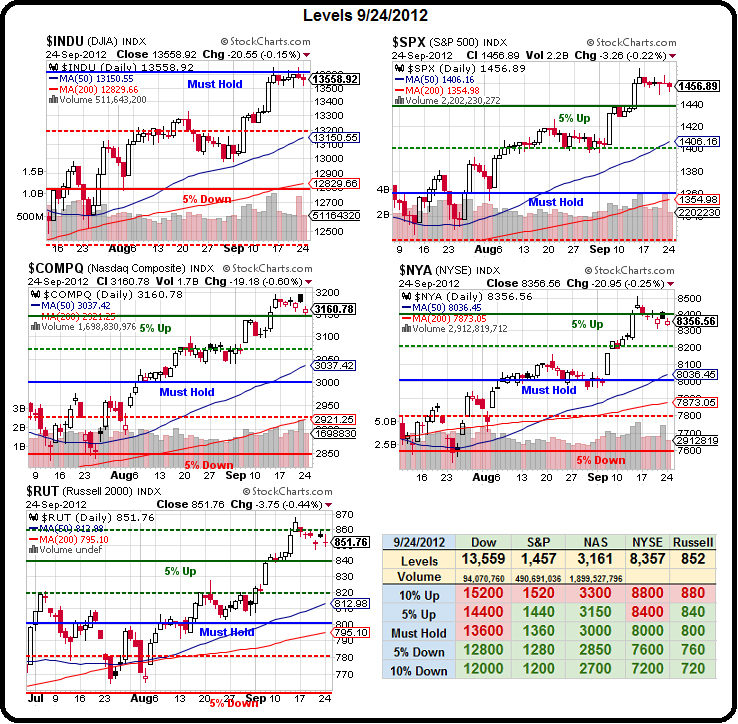
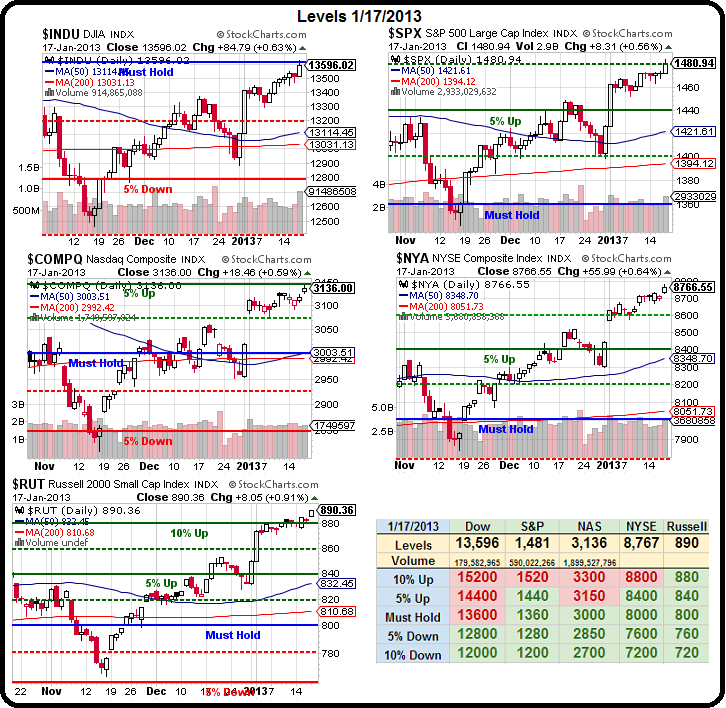
We hit our 13,600 line on the Dow yesterday and this is the point where, last September, when I called the Dow a canary in a coal mine for being the only index not to break it's Must Hold level on the big chart – the same Big Chart we've used all year with the same levels predicted since the Big Crash. We're only living the 5% Rule here – we're a long way from breaking it.
Note how the Big Chart from September 24th of last year looks the same as the current chart (see yesterday's post), right down to the same Striking Cobra pattern that's all the rage now with the TA crowd. We had just had massive QE announced in Europe and Japan and the Fed was extending our own QE but I gave my analysis of the Dow components and concluded they were out of gas and we were likely to be topping.
This was the topic of discussion in yesterday's Member Chat along with my famous Tugboat Theory of Market Movement, which is keeping us in our mid-range TZA hedges – even as the Russell cracks new highs.
 My conclusion at yesterday's close was:
I can't believe the Dow's at 13,600 and AAPL is at $505. Remember when they were talking about putting AAPL in the Dow? That was at $700 and the $200 drop at 8 points per Dollar (Dow is not cap-weighted) would have cost around 1,600 points! As it is though, 13,361 was the tippy top in October but we closed about 13,320 and that was our only day above (with a cliff dive after). So a day above tomorrow, into the long weekend, would be a huge victory but, first, we have to close above today. AAPL was about $666 at the time and the Nas was 3,196 at it's high so very strong if you ignore AAPL's 6% drag on the index.
So, we're much stronger internally on the Nas now than we were then and, hopefully, that means we don't have an air pocket underneath us. The way we made these gains (the hard way) vs. the series of one-day pumps each week (mostly pre-market) that took us up last time is also way different but, still, until we're over our levels for a couple of days – this is where we need to be most cautious of a reversal.
 In that September post, my pick was also TZA ($13.88 at the time) and it shot up almost 50%, to $19.15 on that 7.5% drop in the index – which made it a pretty perfect hedge. Now the Russell (chart by Dave Fry) is over the Big Chart's 10% line at 890 and TZA is down to $11.57 and that's not bad with 900 looming as significant upside resistance as Dave notes – if the RUT does continue higher from here – it will be time for both of us to redraw our charts and THAT would be the bullish sign we didn't get back in September.
It would be great if we simply break out and go higher here but look what a perfect "M" pattern we can make if we drop back to 12,000 (12%) from here. Aesthetics are important too, you know. This is a very serious inflection point we're running into and we'll need an upside catalyst next week with earnings coming up from (among many): VZ, JNJ, IBM, TXN, GOOG, MCD, UTX, AAPL, MMM, UNP, MSFT, T, SBUX, COP, PG, HON, OXY and HAL – if those can't push the Dow up and over – nothing else is likely too and we're back to making that "M".
According to Bespoke, VZ, MCD, ABT, SBUX and HON have the unfortunate habit of missing earnings roughly 50% of the time, with VZ, IBM,PX, BMY, T, COP and PG all historically shakey on revenues. Those are the dice we're rolling next week and we're shoving them all into 4 days as the US markets take MLK Day off on Monday. That's another reason we're adding the SQQQ spread into the weekend – long weekends are always dicey. In general though – we remain bullish until proven otherwise by the loss of our levels. So, in part, our gains act as our hedge for now.

China's GDP was good last night and Japan has vowed to keep printing Yen until it's down another 10% and that's boosting the Dollar back over 80 today and keeping he lid on the Futures so far (8:45). According to Seeking Alpha, the "Great Rotation" is getting legs as $11.3B has gone into global stock mutual funds in the last 2 weeks – the largest 2-week inflow since April 2000 (how'd that one work out?). The theory (open for discussion) is mutual fund flows reflect "Mom and Pop" activity, while ETF flows – money left in the last week – are more dominated by the institutional and trading set. We'll have to see how this plays out but I'm not as worried about "air pockets" under this rally as I was in September and news like this is very encouraging.
Today is expiration day, so not to be taken seriously and we'll see how things stand after the long, Holiday Weekend.
Have a good one,
– Phil