

Reminder: Sabrient is available to chat with Members, comments are found below each post.
Courtesy of Sabrient Systems and Gradient Analytics
Did you buy a market index call option in advance of the  FOMC announcement on Wednesday? Maybe a straddle? Or did you at least hold pat on long positions knowing that you held an implicit “Fed put” against any meaningful downside? It seems like many investors did one of these, as markets have been strong in advance of today’s announcement.
Needless to say, all eyes have been on the Fed this week, with most observers (including me) expecting a modest tapering (down to perhaps $70 billion/month) accompanied by a statement of vigilance to do whatever it takes to keep the economy growing. But they surprised most by announcing no tapering at this time. This cheered investors, since a modest tapering was already priced in, and stocks ended up with the second of two Fed-driven market boosts.
First, although we thought summer was over on Labor Day, Summers wasn’t done until the other day, when economist and former U.S. Treasury Secretary Larry Summers dropped out of contention for the Federal Reserve chairmanship. Stocks reacted well to the news on the assumption that dovish Fed Vice-Chair Janet Yellen will win the job by default — and keep the liquidity faucet either open, or perpetually at the ready. Of course, this came in the wake of positive (i.e., non-military) developments in the Syria saga, so bulls were treated to a double-shot of adrenaline over the weekend.
Then Wednesday’s Fed announcement of no tapering sent the market into turbo-boost, giving a strong technical confirmation to the breakout above 1700 on the S&P500 and the new all-time highs (both intraday and closing). And it occurred on relatively high volume.
As James Taylor sings, “You just call out my name and you know where ever I am, I’ll come running…You’ve got a friend. Ain’t it good to know you’ve got a friend.” Yes, the stock market certainly has a friend in Chairman Bernanke, and all signs point to an equally loyal friend in Janet Yellen for the foreseeable future.
Although the Fed sees progress in the economy, it further cut its forecast for 2013 economic growth to 2.0-2.3% from its June estimate of 2.3-2.5%. Moreover, the statement cited tighter fiscal policy and rising mortgage rates as the main reasons for no change in policy. I have previously discussed the threat that rising interest rates would pose to the important wealth effect of the recovering housing market as a big reason that the Fed wouldn’t completely abandon quant easing anytime soon. But I fully expected a token test of a taper this week. Obviously, the Fed is concerned about creating any shock to the system at all, even though the markets had already priced it in.
Stocks, bonds, and commodities all rallied on Wednesday. Although all sectors rose, the big winners were Utilities and Basic Materials. Utilities surged after the Fed’s announcement because they tend to pay steady dividends, and as alternatives to bonds, they have underperformed (along with bonds) ever since Bernanke suggested that tapering was imminent. The Materials sector got a boost due to the inflationary expectations of ongoing easing, I suspect, as well as the economic growth it may create. Notably, bellwether FedEx (FDX) rose +5% after reporting an earnings beat and revenue growth.
Although P/E multiples are near their historic average of 15, they are typically higher when bond yields are so low. So, the risk premium still allows for higher valuations, unless bond prices come down, pushing up yields and putting a lid on P/E multiple expansion. Ideally, of course, corporate revenues will grow, leading to earnings growth and stock price increases without a reliance on multiple expansion.
And the signs are positive. First of all, don’t fight the Fed. Second, we have Europe recovering, China’s economy looking stable, Syria heading toward a non-military solution, the Fed Chairman succession becoming clearer, and perhaps the hope of some sanity during the upcoming budget and debt ceiling debates.
The SPDR S&P 500 Trust (SPY) closed Wednesday at 173.05, setting a new all-time closing high (as well as a new intraday high of 173.52). It has been exceptionally strong since finding support in late August at its 100-day simple moving average and the uptrend line from June’s bullish reversal, and it broke out above a bullish ascending triangle today. Last week, SPY closed with price bumping up against psychological resistance at 170, and this week brought a test of the highs from early August. With all the positive news emboldening the bulls, there was no need to close the price gap up from September 10. Oscillators RSI, MACD, and Slow Stochastic are all moving into oversold territory as price leapt straight through the upper Bollinger Band.
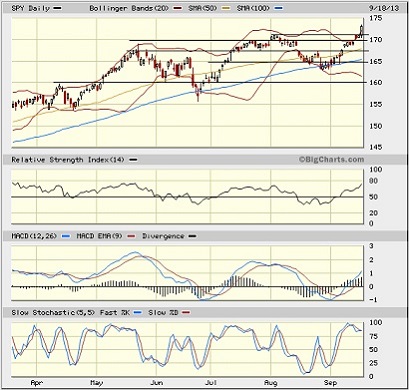
The market will need to take a breather soon, but for now, SPY enjoys clear blue skies above and lots of lines of support as shown, starting with resistance-turned-support at the prior highs, followed by 170, the 50-day SMA, 167.5, the 100-day SMA, 165, 160, and then the 200-day SMA around 158.
The CBOE Market Volatility Index (VIX), a.k.a. “fear gauge,” closed Wednesday at 13.59. It had been meandering upward for the past few days, even as the market moved up. But it has remained below the 15 threshold, indicating a lack of fear.
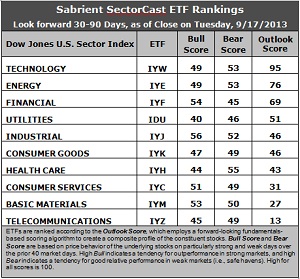
Latest rankings: The table ranks each of the ten U.S. business sector iShares ETFs by Sabrient's proprietary Outlook Score, which employs a forward-looking, fundamentals-based, quantitative algorithm to create a bottom-up composite profile of the constituent stocks within the ETF. The multi-factor model considers forward valuation, historical earnings trends, earnings growth prospects, the dynamics of Wall Street analysts' consensus estimates, accounting practices and earnings quality, and various return ratios. In addition, the table also shows Sabrient's proprietary Bull Score and Bear Score for each ETF.
High Bull score indicates that stocks within the ETF have tended recently toward relative outperformance during particularly strong market periods, while a high Bear score indicates that stocks within the ETF have tended to hold up relatively well during particularly weak market periods. Bull and Bear are backward-looking indicators of recent sentiment trend.
As a group, these three scores can be quite helpful for positioning a portfolio for a given set of anticipated market conditions.
Observations:
1. Technology (IYW) remains in the top spot with an impressive Outlook score of 95. It rarely gets higher than that. IYW displays a low forward P/E, a solid projected long-term growth rate, and the best return ratios. Also, sentiment among both Wall Street analysts and company insiders, which has been its weakness, seems to be improving a bit. Energy (IYE) continues in the second spot with a score of 76. IYE displays the lowest forward P/E and solid return ratios, but suffers from weak sentiment among analysts and insiders. Rounding out the top five once again are Financial (IYF), Utilities (IDU), and Industrial (IYJ).
2. Telecom (IYZ) is in the cellar yet again with an Outlook score of 13, but sentiment continues to improve among Wall Street analysts and insiders. Still, IYZ remains weak in most factors across the board, including a high forward P/E, low return ratios, and modest projected long-term growth. Returning to the bottom two this week is Basic Materials (IYM) with a score of 27, due to relatively poor analyst sentiment in the form of net downgrades to earnings estimates and modest scores on the other factors.
3. This week’s fundamentals-based rankings maintain their bullish bias as the four of the five highest-ranked sectors are all economically sensitive — Technology, Energy, Financial, and Industrial.
4. Looking at the Bull scores, Industrial (IYJ) remains the clear leader on particularly strong market days, scoring 56, while Utilities (IDU) sunk further as the lowest at 40 (before today’s big up-move) The top-bottom spread as widened considerably to 16 points, which indicates falling sector correlations on particularly strong market days.
5. Looking at the Bear scores, Healthcare (IYH) is the favorite “safe haven” on weak market days, scoring 55, while Financial (IYF) is the lowest at 45. The top-bottom spread is a narrow 10 points, and 7 of the 10 are bunched in the range of 49-53, all of which indicates relatively high sector correlations on particularly weak market days, i.e., across-the-board selling during extreme market weakness (although we haven’t had much of that lately from which to judge).
6. Overall, IYW shows the best all-weather combination of Outlook/Bull/Bear scores. Adding up the three scores gives a total of 197. IYZ is the by far the worst at 107. Looking at just the Bull/Bear combination, IYJ displays the highest score of 108 this week, which indicates good relative performance in extreme market conditions (whether bullish or bearish), while IDU is by far the lowest at 86, which indicates notable investor avoidance during extreme conditions.
These Outlook scores represent the view that Technology and Energy sectors are still relatively undervalued, while Telecom and Consumer Services may be relatively overvalued based on our 1-3 month forward look.
Some top-ranked stocks within IYW and IYE that look good to me this week include Cognizant Technology Solutions (CTSH), QUALCOMM (QCOM), EOG Resources (EOG), and EQT Corp (EQT).
In case I’m not being clear enough for all readers, let me summarize. The economic picture is bullish for stocks, the technical picture is bullish, and the Sabrient rankings are generally bullish. With lots of idle cash and the excuses for investor caution gradually falling by the wayside, there is a lot of upside potential into year-end.
As a reminder, Sabrient’s annual Baker’s Dozen portfolio of top stocks for 2013 continues to impress. It is now up +31% from the portfolio’s inception on January 11, versus the S&P 500 return of +17% over the same timeframe. In fact, all 13 stocks are comfortably positive, led by Jazz Pharmaceuticals (JAZZ), Genworth Financial (GNW), EPL Oil & Gas (EPL), and Ocwen Financial (OCN). (Note: last year’s portfolio was up +43%.)
Disclosure: Author has no positions in stocks or ETFs mentioned.
About SectorCast: Rankings are based on Sabrient’s SectorCast model, which builds a composite profile of each equity ETF based on bottom-up aggregate scoring of the constituent stocks. The Outlook Score employs a fundamentals-based multi-factor approach considering forward valuation, earnings growth prospects, Wall Street analysts’ consensus revisions, accounting practices, and various return ratios. It has tested to be highly predictive for identifying the best (most undervalued) and worst (most overvalued) sectors, with a 1-3 month forward look.
Bull Score and Bear Score are based on the price behavior of the underlying stocks on particularly strong and weak days during the prior 40 market days. They reflect investor sentiment toward the stocks (on a relative basis) as either aggressive plays or safe havens. So, a high Bull score indicates that stocks within the ETF have tended recently toward relative outperformance during particularly strong market periods, while a high Bear score indicates that stocks within the ETF have tended to hold up relatively well during particularly weak market periods.
Thus, ETFs with high Bull scores generally perform better when the market is hot, ETFs with high Bear scores generally perform better when the market is weak, and ETFs with high Outlook scores generally perform well over time in various market conditions.
Of course, each ETF has a unique set of constituent stocks, so the sectors represented will score differently depending upon which set of ETFs is used. For Sector Detector, I use ten iShares ETFs representing the major U.S. business sectors.
About Trading Strategies: There are various ways to trade these rankings. First, you might run a sector rotation strategy in which you buy long the top 2-4 ETFs from SectorCast-ETF, rebalancing either on a fixed schedule (e.g., monthly or quarterly) or when the rankings change significantly. Another alternative is to enhance a position in the SPDR Trust exchange-traded fund (SPY) depending upon your market bias. If you are bullish on the broad market, you can go long the SPY and enhance it with additional long positions in the top-ranked sector ETFs. Conversely, if you are bearish and short (or buy puts on) the SPY, you could also consider shorting the two lowest-ranked sector ETFs to enhance your short bias.
However, if you prefer not to bet on market direction, you could try a market-neutral, long/short trade—that is, go long (or buy call options on) the top-ranked ETFs and short (or buy put options on) the lowest-ranked ETFs. And here’s a more aggressive strategy to consider: You might trade some of the highest and lowest ranked stocks from within those top and bottom-ranked ETFs.