

Courtesy of Sabrient Systems and Gradient Analytics
Despite a highly eventful week in the news, not much has changed from a stock market perspective. No doubt, investors have grown immune to the daily reports of geopolitical turmoil, including Ukraine vs. Russia for control of the eastern regions, Japan’s dispute with China over territorial waters, Sunni vs. Shiite for control of Iraq, Christians being driven out by Islamists, and other religious conflicts in places like Nigeria and Central African Republic. But last Thursday’s news of the Malaysian airliner tragically getting shot down over Ukraine, coupled with Israel’s ground incursion into Gaza, had the makings of a potential Black Swan event, which in my view is the only thing that could derail the relentless bull march higher in stocks.
Nevertheless, when it became clear that the airliner catastrophe was most likely a mistake born of incompetence among the rag-tag rebels rather than the start of an orchestrated terrorist attack on the West, I fully expected a recovery on Friday, which we got. And so the upward march of stocks continues.
In this weekly update, I give my view of the current market environment, offer a technical analysis of the S&P 500 chart, review our weekly fundamentals-based SectorCast rankings of the ten U.S. business sectors, and then offer up some actionable trading ideas, including a sector rotation strategy using ETFs and an enhanced version using top-ranked stocks from the top-ranked sectors.
Market overview:
Thursday’s brief scare gave the S&P 500 its first single-day decline of more than 1% in three months, while the CBOE Market Volatility Index (VIX) surged 32%, which was its biggest single-day percentage increase since April 2013. Moreover, NYSE volume increased 20% over its daily average for the month. Friday’s bounce saw the Dow Jones Industrials Index regain the 17,000 level, but the Wilshire 5000 Total Market Index was not able to get back above 21,000. Also, both the Dow and S&P 500 are encountering resistance as they re-approach their 52-week highs, and the Russell 2000 small caps are facing resistance from its 50-day simple moving average. I still think there may be more downside in store before summer is over.
Continued strength in U.S. stocks is being driven by expectations of continued low interest rates, a big jump in GDP growth, and improving corporate earnings. Indeed, all major central banks are providing global liquidity and low interest rates. And the start of earnings season has looked promising so far. For example, Skyworks Solutions (SWKS) is a Sabrient favorite that I have written about several times recently as a top pick in the Technology sector, and it reported blowout earnings after the close on Thursday, leading to a +14% day on Friday. SWKS is also included in the new Forward-Looking Value portfolio (which is offered as a unit trust through strategic partner First Trust Portfolios).
Treasury bonds continue to strengthen, with a low 10-year yield of 2.48% and 30-year at 3.29%. Of course, these persistently low yields continue to push investors into equities in their search for both income and total return. So long as the 10-year that remains under 3.5%, it should continue to be a favorable environment for equities. Assuming unemployment continues to fall, eventually there will be wage inflation, which would be the first step toward price inflation — and higher interest rates.
The VIX, a.k.a. fear gauge, closed last Friday at 12.06, which is right back where it closed the prior Friday, despite the ominous news of the week. It briefly spiked above 15 on Thursday after the commercial jet was shot down, but quickly retreated on Friday. In fact, some traders are suggesting that this new normal of low VIX has rendered it essentially worthless as a separate and tradable asset class. Today, it seems that VIX calls and index hedges are only good for protection against catastrophe and the rare Black Swan event, rather than for swing trading periods of market weakness.
SPY chart review:
The SPDR S&P 500 Trust (SPY) closed last Friday at 197.71, after touching its 52-week high (from July 3) on Wednesday. Even before the big new events, the upper line of the long-standing bullish rising channel has continued to offer extremely tough resistance. So far, however, the 20-day simple moving average has offered strong support despite some minor violations, and the mini rising channel I described last week is still intact, as well. Oscillators RSI, MACD, and Slow Stochastic have all worked off even more of their overbought conditions (a weak day like Thursday is good for hastening the cycle), but are still a long ways from oversold territory. Overall, the chart looks neutral at this level, awaiting a catalyst to help propel it in one direction or the other.
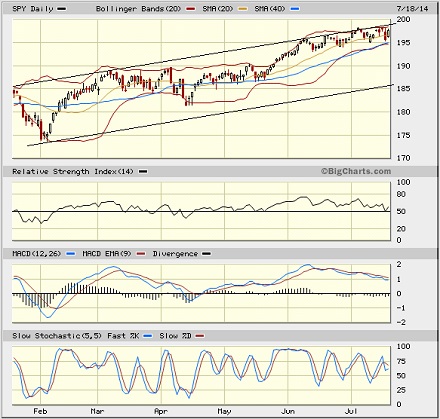
Some technicians have suggested that a full 50% Fibonacci retracement of the SPY move from its May low to July high will take the it down to a test of support at the 50-day SMA near 194. The 200-day SMA is all the way down around 185, just below the bottom line of the larger rising bullish channel. On the top side, the 200 level continues to serve as both an enticing bullish target and a potential ambush location by hungry bears.
Notably, the recovery in the Russell 2000 small cap index, which rallied back above the 1200 level from a May double-bottom formation, is now in doubt. The 50-day SMA first offered some support, but now appears to be potential resistance. Bulls will need to recruit some small cap enthusiasts.
Latest sector rankings:
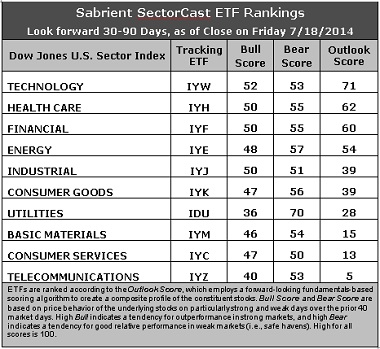
Relative sector rankings are based on our proprietary SectorCast model, which builds a composite profile of each equity ETF based on bottom-up aggregate scoring of the constituent stocks. The Outlook Score employs a forward-looking, fundamentals-based multifactor algorithm considering forward valuation, historical and projected earnings growth, the dynamics of Wall Street analysts’ consensus earnings estimates and recent revisions (up or down), quality and sustainability of reported earnings (forensic accounting), and various return ratios. It helps us predict relative performance over the next 1-3 months.
In addition, SectorCast computes a Bull Score and Bear Score for each ETF based on recent price behavior of the constituent stocks on particularly strong and weak market days. High Bull score indicates that stocks within the ETF recently have tended toward relative outperformance when the market is strong, while a high Bear score indicates that stocks within the ETF have tended to hold up relatively well (i.e., safe havens) when the market is weak.
Outlook score is forward-looking while Bull and Bear are backward-looking. As a group, these three scores can be helpful for positioning a portfolio for a given set of anticipated market conditions. Of course, each ETF holds a unique portfolio of stocks and position weights, so the sectors represented will score differently depending upon which set of ETFs is used. We use the iShares that represent the ten major U.S. business sectors: Financial (IYF), Technology (IYW), Industrial (IYJ), Healthcare (IYH), Consumer Goods (IYK), Consumer Services (IYC), Energy (IYE), Basic Materials (IYM), Telecommunications (IYZ), and Utilities (IDU). Whereas the Select Sector SPDRs only contain stocks from the S&P 500, I prefer the iShares for their larger universe and broader diversity. Fidelity also offers a group of sector ETFs with an even larger number of constituents in each.
Here are some of my observations on this week’s scores:
1. After gradually moving up the rankings, ultimately achieving the top Outlook score last week, Energy has suddenly fallen back to fourth place this week, as the sell-side analysts and insiders have cooled their enthusiasm (upward earnings revisions and insider buying). Technology has returned to the top spot, albeit with a modest Outlook score of only 71. Although sentiment among both Wall Street analysts and insiders is unimpressive and the forward P/E is looking somewhat less attractive, companies within Technology display relatively solid scores in the other model factors, including a good forward long-term growth rate and strong return ratios. Regarding forward P/E, most of the sectors are looking less attractive on this metric as valuation multiples have become elevated across the board, with the notable exception of Financial (and to a lesser extent, Energy), which has allowed Financial to take third place. Healthcare moves up to the second spot this week, with the best sell-side analyst sentiment, a solid forward long-term growth rate, and reasonable return ratios. Energy and Industrial round out the top five.
2. Telecom stays in the cellar this week with an Outlook score of 5, as it displays generally poor factor scores across the board. Consumer Services/Discretionary returns to the bottom two with a score of 13, despite the strongest forward long-term growth rate, as analysts continue to revise downward while the forward P/E remains relatively high.
3. Looking at the Bull scores, Technology is the leader despite a relatively low score of 52, while Utilities is the clear laggard at 36. The skew among sector Bull scores is to an average well below 50, which is not particularly bullish. The top-bottom spread is 16 points, reflecting average sector correlations on particularly strong market days. It is generally desirable in a healthy market to see lower correlations and a top-bottom spread of at least 20 points, which indicates that investors have clear preferences in the stocks they want to hold, rather than the all-boats-lifted-in-a-rising-tide mentality that dominated 2013.
4. Looking at the Bear scores, Utilities is the clear leader with a solid score of 70, which means that stocks within this sector have been the preferred safe havens on weak market days. Consumer Services/Discretionary displays the lowest score of 50. Notably, all sectors are scoring above 50, which is somewhat bearish. The top-bottom spread is 20 points, reflecting low sector correlations on particularly weak market days. Again, it is generally desirable in a healthy market to see low correlations and a top-bottom spread of at least 20 points.
5. Technology displays the best all-weather combination of Outlook/Bull/Bear scores, while Telecom is by far the worst. Looking at just the Bull/Bear combination, Utilities is the leader, theoretically indicating superior relative performance (on average) in extreme market conditions (whether bullish or bearish), but right behind is a four-way tie among Tech, Healthcare, Financial, and Energy, so in fact there is no clear leader here. Telecom scores the lowest, indicating general investor avoidance during extreme conditions.
6. Overall, although not clear-cut, this week’s fundamentals-based Outlook rankings look slightly bullish to me, mainly because the top five Outlook scores also display the top five Bull scores, with economically-sensitive Technology, Financial, and Industrial in the top five.
These Outlook scores represent the view that the Technology and Healthcare sectors are relatively undervalued, while Telecom and Consumer Services/Discretionary may be relatively overvalued based on our 1-3 month forward look.
Stock and ETF Ideas:
Our Sector Rotation model, which appropriately weights Outlook, Bull, and Bear scores in accordance with the overall market’s prevailing trend (bullish, neutral, or bearish), suggests holding Technology, Healthcare, and Financial (in that order) in the prevailing bullish climate. (Note: In this model, we consider the bias to be bullish from a rules-based standpoint because SPY is still above its 50-day simple moving average while also remaining above its 200-day SMA.)
Other highly-ranked ETFs from the Technology, Healthcare, and Financial sectors include Market Vectors Semiconductor ETF (SMH), iShares Global Healthcare ETF (IXJ), and SPDR S&P Capital Markets ETF (KCE).
For an enhanced sector portfolio that enlists top-ranked stocks (instead of ETFs) from within Technology, Healthcare, and Financial, some long ideas include Broadcom (BRCM), NXP Semiconductors NV (NXPI), DaVita HealthCare Partners (DVA), Gilead Sciences (GILD), CIT Group (CIT), and SunTrust Banks (STI). All are highly ranked in the Sabrient Ratings Algorithm and also score in the top quintile (lowest accounting-related risk) of our Earnings Quality Rank (EQR), a pure accounting-based risk assessment signal based on the forensic accounting expertise of our subsidiary Gradient Analytics. We have found it quite valuable for helping to avoid performance-offsetting meltdowns in our model portfolios.
Notably, Gradient’s prowess at evaluating the quality and sustainability of a company’s reported earnings, its accrual accounting practices, and insider selling activity was once again demonstrated last week when Cepheid (CPHD) fell -9% after its earnings report. Gradient recently published a comprehensive report and a negative rating on CPHD, detailing a number of key concerns.
If you are more comfortable with a neutral market bias, the Sector Rotation model still suggests holding Technology, Healthcare, and Financial (in that order). But if you have a bearish outlook on the market, the model suggests holding Utilities, Energy, and Healthcare (in that order).
Disclosure: Author has no positions in stocks or ETFs mentioned.
Disclaimer: This newsletter is published solely for informational purposes and is not to be construed as advice or a recommendation to specific individuals. Individuals should take into account their personal financial circumstances in acting on any rankings or stock selections provided by Sabrient. Sabrient makes no representations that the techniques used in its rankings or selections will result in or guarantee profits in trading. Trading involves risk, including possible loss of principal and other losses, and past performance is no indication of future results.