

25.6 C
New York
Tuesday, August 11, 2026

Testy Tuesday – Small Businesses More Optimistic as Nasdaq Prepares to Test 30,000 (again)

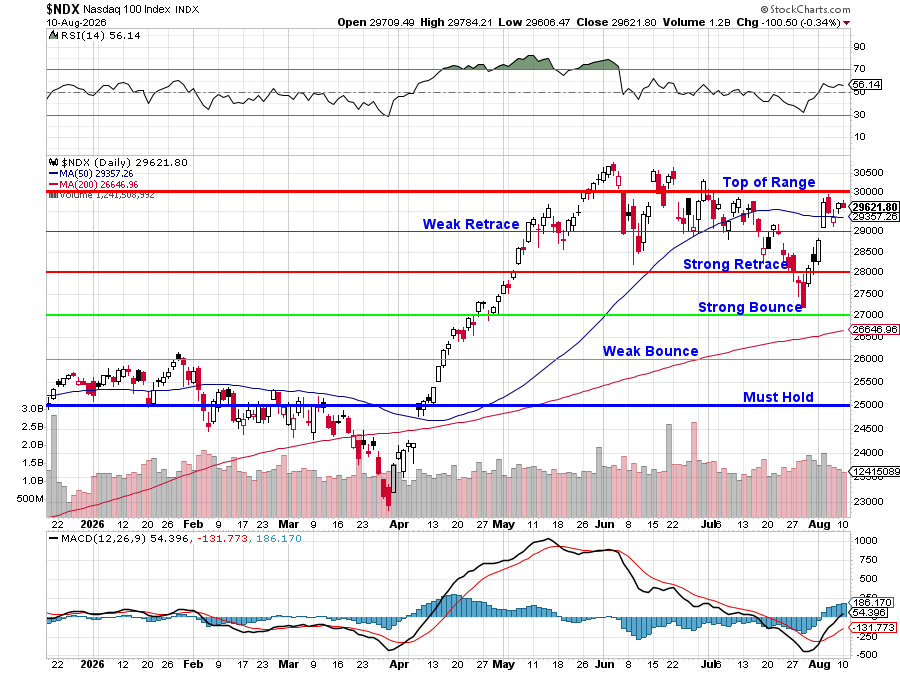
Here we go again! 

To the Nasdaq’s advantage at the moment, RSI is “only” at 56 (70 is overbought) and MACD is not even neutral so there’s TECHNICALLY plenty of room to run for the Nasdaq – though that will make it all the more tragic if we fail again at 30K. I would say 400 points is a lot to cover but it’s not anymore, is it? In fact, it’s only 1.4% these days. 

The real drama is the now-declining 50-day moving average, which has curved down for the first time since Feb, when the Nasdaq gave up 3,000 points (11.5%) in 2 months – so we’ll be adding hedges as soon as/IF the 50 dma does fail! To pull that line out of a tailspin, we need to close above it for a few consecutive days so watch 29,357 as a key point of potential failure into the weekend. 

See how easy TA is? But, of course, that’s not TA – it’s MATH! We’re talking about the math that CAUSES the chart to generate a shape – NOT the “tail wagging the dog” that is generally TA analysis. If you want to know how a chart will look in the future – DO THE MATH NOW! 

Notice the entire recent bounce was built on 4 strong days which were “window-dressing” at the end of July and Big Bank and Mag 7 earnings and, since then, the volume is trailing off and we are drifting – this is not the kind of conviction strength we need to break back over 30,000, is it?  
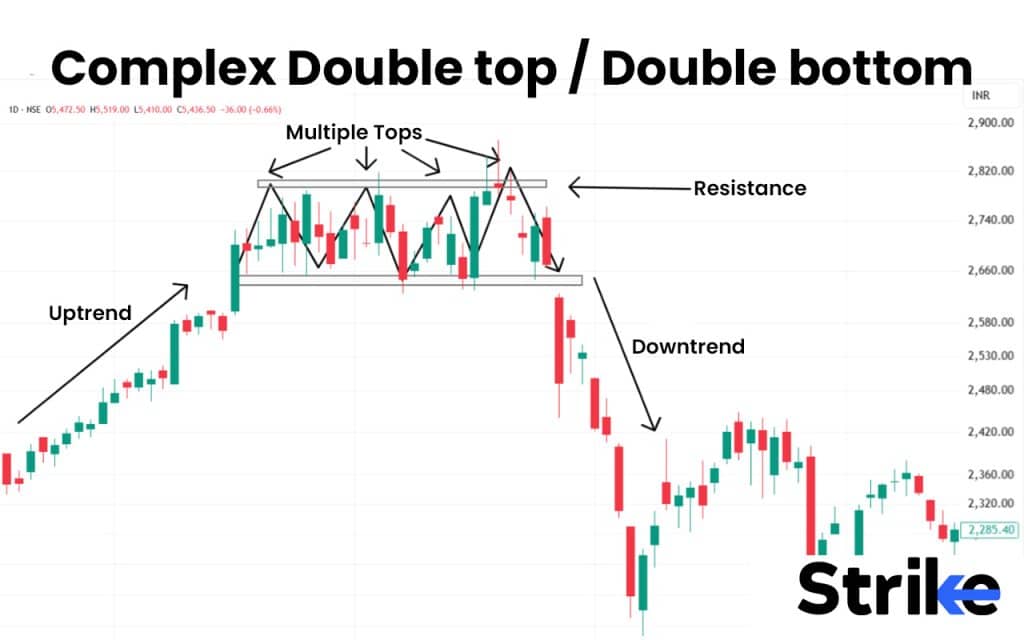
55 Trading Chart Patterns for Smarter Market Predictions

Oh dear – that does look foreboding, doesn’t it? Well, the VIX is 15.54 so they’re not worried so why should we be? Actually, we shouldn’t be – we’re mainly in cash and heavily hedged so, if the market does drop – it’s simply time for us to go shopping but that doesn’t mean our portfolios won’t take a hit and no one LIKES taking a hit – even if it does provide us with buying opportunities.  

🫏 So let’s talk about the thing nobody wants to say out loud: we think a 10%+ correction is more likely than not and we’re STILL invested. That looks insane written down. It isn’t – and the reasoning is the whole edge, the difference between “Being the House” and just being a nervous gambler who happens to own some hedges.

Why stay in if you think it’s going down?

Start with the honest admission: nobody KNOWS it’s going down. We THINK it’s likely. Those are different words and the gap between them is where all the money lives. If this were a 90%-certain crash, the play would be cash and short, full stop.

But it isn’t 90%. It’s closer to 60/40 that we correct 10%+ before we make a sustained new high – and look at what’s holding up that 40%: small business optimism just hit 99.8 – an 11-month high, with hiring plans at their strongest since October 2022! That is not the read of an economy about to roll over. Earnings came in strong enough to force target raises across the Street. The bull case is real, which is exactly why you don’t bet the farm against it.

So the question isn’t “up or down?” It’s: what’s the right position when you’re 60/40 bearish but the 40% is a genuine expansion that could run another year? The answer is not “all in.” It’s not “all out.” It’s the thing we actually do – heavily hedged, mostly cash, still holding the quality names that pay us to wait.

The math of the asymmetric bet

A decision under uncertainty is just an expected-value problem wearing an emotional costume. So strip the costume off and put the four outcomes in a grid:

  Market RISES Market FALLS 10%+
You’re in CASH ❌ Miss the whole rally. Feels safe, but 40% of the time you left serious money on the table – and you now have to time re-entry, which nobody does well. ✅ Feel like a genius. But you still have to buy back in, and most people who sell before a drop repurchase higher than they sold. Two decisions, both must be right.
You’re HEDGED + quality ✅ You participate. Hedges cost a little drag. You win, just by slightly less. ✅ Hedges do their job, pain is buffered – and you have dry powder to shop while everyone else is forced to sell.


Read the corners. The cash row has one catastrophic box (miss the bull) and one box that only pays off if you also nail the re-entry. The hedged row has no catastrophic box – worst case is a little drag. That’s the entire point: this isn’t a prediction that the market falls. It’s a refusal to hold any position that a single wrong guess can blow up. The House doesn’t know which number hits. It just makes sure no one spin can break it.

The hard part: your gains ARE your hedge

Here’s the concept that’s genuinely difficult to hold in your head. After a couple of enormous months, the portfolios are way up – and those excess gains are, functionally, a pre-paid hedge. Almost nobody can emotionally treat them that way.

Run the mechanics. A portfolio up 40% on the year takes a 10% market correction down to +26%. On paper you “lost” 14 points. In reality you gave back a slice of a windfall and you’re still up 26% on the year. But the brain doesn’t file it as “still up 26%.” It files it as “I was up 40% and now I’m not” – and that felt loss is why people do the single dumbest thing at the worst possible time: they sell into the correction to stop the bleeding of gains they never actually spent.

Say it plainly: the money made in the good months is the buffer that lets you survive the bad ones without flinching. A portfolio grinding out 8% a year has no cushion – a 10% drop puts it underwater and its owner panics at the bottom. A portfolio that ran up 40% can eat a 10% correction and still be having its best year in a decade. Those gains aren’t just profit. They’re the margin – financial and emotional – that lets an investor act like the House while everyone else is losing their nerve.

The trap is that it doesn’t feel like a hedge. A hedge you buy – SQQQ at $37.73, a put spread, anything with a ticker – feels like protection because you paid cash for it. Gains-as-buffer feels like something being taken away when it recedes. Same protection, opposite emotional sign. The work is training yourself to feel the +26% as the win it is, instead of the -14% as a loss it isn’t. Nobody does this by instinct. It’s a learned discipline, and the discipline is simple: decide where your line is before the emotion shows up.

And what does Phil teach us? If you have $100 and a 50% hedge against a 20% loss, if the market drops 20% – you will have $80 + $10 from your hedge. YES, that is only $90 but now you can go shopping for the same stocks that now cost $80. You can buy 12.5% MORE STOCK than you could when you had $100 and the market was at $100.

If you are a long-term investor who expects the market to recover and go higher – this is a fantastic outcome – NOT a disaster!  

So where do we draw the line?

You cannot draw a rational line while standing inside the fear. You draw it now, in the calm, with the VIX at 15.56 and everyone relaxed. And the line isn’t a price – it’s a set of rules:

      • Hold the quality. Real cash flow, real moats, names worth owning 10% cheaper anyway. If you wouldn’t panic-sell them in a correction, there’s no reason to pre-sell them now.

      • Scale the hedges to the math, not the mood. The moment the Nasdaq’s 50-day fails – watch 29,357 – add protection. That’s the math turning, not a feeling turning.

      • Write the shopping list in advance. A 10% correction isn’t a disaster; it’s a buying list you should already own on paper. Without the list ready, a drop becomes fear instead of opportunity.

      • Accept the give-back as the cost of staying rational. Some gains come back in a correction. That is not a failure of the strategy – that is the strategy. The alternative, timing the exact top and exact bottom, is a two-decision trade that even great investors lose more often than they win.

The least comfortable sentence in all of this: the goal was never to avoid every hit. The goal is to have made so much on the way up, and be so well-hedged on the way down, that a 10% correction is a buying opportunity you can afford to enjoy – instead of an emergency you have to survive. That is what “Be the House” means once the tape gets scary. The House doesn’t flinch at a losing spin. It priced that spin in months ago, back when everything was calm.

VIX says nobody’s worried. Small business optimism is at an 11-month high. Earnings were strong. And there’s still a better-than-even chance the market corrects. Holding all four of those in your head at once – without flinching toward the exit or toward the FOMO – is the job. That’s the whole job.

😎 Yesterday, in our Live Member Chat Room (join here), we talked about using our Watch List to identify stocks we like that are going on sale. The charts on the list are dynamic – constantly updating – and that makes it easy to see where the bargains are. There’s about 100 stocks we’d very much like to buy if they get cheaper and, in a good crash (we love a good crash!), the babies are often thrown out with the bathwater.  

For example (one of 13 Boaty and I are looking at today – will post in chat) that will make this post a Top Trade Alert is:  

🚢 LVS — At the 52-week low because the roulette wheel misbehaved

Finviz Chart

What actually happened

Q2 2026 EPS was $0.59 vs $0.77 estimate — a miss. Revenue $3.154B, also short.

Here’s the Operational Check:

The miss wasn’t operational, it was mechanical. LVS reported Macau EBITDA of $430M. VIP rolling hold percentage that quarter was 1.35% — well below the theoretical ~3.0-3.2%. Normalized for expected hold, Q2 Macau EBITDA would have been $517M, $87M higher. That’s a full nickel of EPS. Hold is variance, not a business condition.

Underneath the mechanical miss, the business trajectory is stronger than the market thinks:

Quarterly Highlights

        • Sands China rolling volume +73% YoY

        • Non-rolling drop +15% YoY

        • Slot and ETG handle +30% YoY

        • Mass GGR grew 8% YoY vs the market’s 4% — Sands took share

        • SCL VIP rolling chip volume share hit a market-leading 26%

The Macau target of $700M quarterly EBITDA is intact — management reaffirmed it. At $700M x 4 = $2.8B annualized Macau EBITDA alone, plus Marina Bay Sands running at record levels, LVS on that run-rate trades under 8x EV/EBITDA.

Marina Bay Sands

Marina Bay Sands Expansion Project

Why did it fall -35.5% from the high

        1. June softness from the FIFA World Cup pulling Asian consumers to TVs instead of tables (temporary — the World Cup ends).

        2. Fear that Trump-China tariffs kill Chinese consumer travel — but Macau visitation has actually held up because it’s a domestic-China trip, not international. The tariff/travel narrative was misapplied to Macau.

        3. Multi-year capex fear — the Venetian is undergoing a full 2,900-room renovation through Chinese New Year 2028. Market is punishing the ROI wait. But Londoner and Four Seasons Grand Suites already showed the playbook works.

The catalysts still ahead

        • Q3 report (October) — with normal hold, this print should reset the miss narrative. World Cup is behind them.

        • Marina Bay Sands expansion opens early 2031, but the milestones and images between now and then are catalysts every quarter.

        • $6B buyback authorization refreshed — they repurchased $787M just in Q2. Over the last 11 quarters they’ve retired 16.3% of shares outstanding. That is the loudest possible signal from management on where they think the stock is.

        • Venetian premium salons opening through 2027 — a $700M-EBITDA-target property is being upgraded to premium-mass yields.

Sands China: Consistently Generating the Leading Share of Macao Market EBITDA

Analyst backdrop

85.7% bullish, average PT $59.71 = 31.3% upside. The 52-week low is $44.21 — we are literally $1.25 above the floor. Risk is quantifiable.

Trade idea for the Long-Term Portfolio: 

    • Sell 10 LVS 2028 $47.50 puts for $7.50 ($7,500)
    • Buy 25 LVS 2028 $40 calls for $11 ($27,500) 
    • Sell 13 LVS 2028 $55 calls for $5 ($6,500) 

    • Sell 10 LVS Jan 47.50 calls for $3.50 ($3,500)

    • Sell 10 LVS Jan $45 puts for $3.65 ($3,650) 

This is our new policy for Top Trade Alerts – we time the short-term premiums sales to the next review, rather than quarterly – so we can stay on top of the adjustments.

In this case, the net cash entry is just $6,350 on the $37,500 spread so there’s $31,150 (490%) upside potential PLUS we have two more halves to sell $7,150 in premium is another potential $14,300 (225%) against the risk of owning 2,000 shares of LVS for about $45 (we’d roll, of course) so $90,000 or $45,000 in ordinary margin and far less in a Portfolio Margin account – so it’s a very efficient trade!  

See, there’s always something fun to buy IF you have the CASH!!! and you are prepared to take advantage of the opportunity.  

And here’s a note on hedging to tie everything all together: 

Let’s say we’re worried the market will drop 30% and take LVS with it, that would be $30 (p/e of 8 unless that changes too) – so we’re down $15 x 2,000 shares is $30,000 on a forced entry at $45. THAT is what we need to hedge against – not the entire $90,000 assignment!  

When we hedge, we hedge against rational risks – that way we don’t overpay and waste our profits on too much insurance. Because that’s what hedging is – INSURANCE!  


1 COMMENT

Subscribe
Notify of
1 Comment
Inline Feedbacks
View all comments

Stay Connected

148,513FansLike
396,312FollowersFollow
2,720SubscribersSubscribe

Latest Articles

1
0
Would love your thoughts, please comment.x
()
x