

Courtesy of Sabrient Systems and Gradient Analytics
Although the stock market displayed weakness last week as I suggested it would, bulls aren’t going down easily. In fact, they’re going down swinging, absorbing most of the blows delivered by hesitant bears. Despite holding up admirably when weakness was both expected and warranted, and although I still see higher highs ahead, I am still not convinced that we have seen the ultimate lows for this pullback. A number of signs point to more weakness ahead.
In this weekly update, I give my view of the current market environment, offer a technical analysis of the S&P 500 chart, review our weekly fundamentals-based SectorCast rankings of the ten U.S. business sectors, and then offer up some actionable trading ideas, including a sector rotation strategy using ETFs and an enhanced version using top-ranked stocks from the top-ranked sectors.
Market overview:
The Dow Jones Industrials, S&P 500, and NASDAQ all broke their string of five weekly gains, even though the bulls were reluctant to give up much ground. We are now halfway through the historically weak month of September, including the always worrisome 9/11 anniversary, and so far the bulls have shown little inclination to throw in the towel. Somewhat surprisingly given overall market weakness, traditionally-defensive sector Utilities was the weakest sector last week. Energy and Basic Materials were also weak, while Healthcare held up the best. With the yield on the 10-year U.S. Treasury closing Friday at 2.61%, we have seen some weakening in Treasuries, and thus in higher-yielding Utilities stocks, as well. Also, the U.S. REIT index fell 3%.
All eyes will be on Wednesday afternoon’s FOMC policy statement and their current sentiment regarding interest rates. I still think there is greater downside potential in the 10-year yield, especially given global liquidity and the resulting demand for the safety of U.S. Treasuries. Moreover, ECB quant easing has led to a fall in the British pound and the euro. This has led to a notable strengthening in the U.S. dollar, which has helped keep inflation low, thus giving the Fed room to remain accommodative, which in turn is supportive of elevated valuation multiples in equities.
Nevertheless, although I expect the market to finish the year higher than it is now, there are plenty of reasons to be concerned about near-term market weakness. For example, according to the Stock Trader’s Almanac, the week following options triple-witching day (which is coming up this Friday), usually is a down week for the overall market — and sometimes extremely weak (like in 2011 when the Dow Jones Industrials dropped over 700 points). Moreover, the technical picture has weakened, as described below.
The CBOE Market Volatility Index (VIX), a.k.a. fear gauge, closed Friday at 13.31, which is below the important 15 level but above its 50-day simple moving average, which has been providing some resistance, and it is now challenging resistance from its 200-day SMA.
By the way, Sabrient’s annual Baker’s Dozen portfolio of 13 top picks for the year has suddenly surged to the lead among the firms tracked by this third-party performance tracking site. Our annual portfolio also outperformed the other portfolios over the prior two years since this site began tracking us. Baker’s Dozen represents a sector-diversified group of stocks based on our Growth At a Reasonable Price (GARP) quant model and confirmed by a rigorous forensic accounting review by our subsidiary Gradient Analytics to help us avoid the landmines. Top performers include NXP Semiconductors (NXPI), Southwest Airlines (LUV), and Actavis plc (ACT).
SPY chart review:
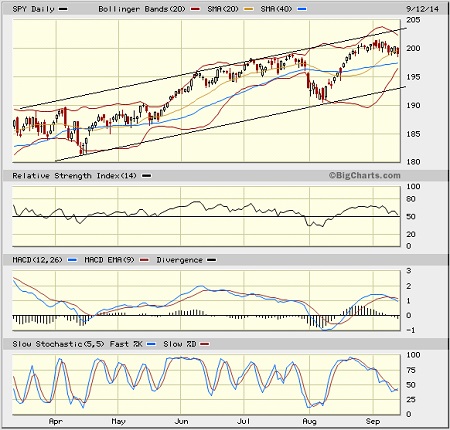
The SPDR S&P 500 Trust (SPY) closed last Friday at 199.13, which of course is back below the psychologically difficult 200 level, and it is struggling to hold support at its 20-day simple moving average. As I discussed last week, SPY didn’t actually confirm a breakout last week as it might have appeared to some investors. It has spent some time intraday below the 200 level virtually every day since it initially breached this psychological level. The challenge for bullish investors still remains recruiting enough new bullish conviction to break out in earnest. The top line of the bullish rising channel has proven to be extremely strong resistance, as expected, but because it is rising, stocks can continue to rise, as well, even without an upside breakout. Oscillators RSI, MACD, and Slow Stochastic were each looking neutral to me a week ago, but after last week’s market weakness, they are all pointing down bearishly now. Support at the 50-day SMA sits around 197.5, the 100-day sits near 194, the bottom of the bullish rising channel sits near 193, and the important 200-day is all the way down at 188.
The Russell 2000 small cap index looks even worse, with its 50-day SMA threatening to cross down through its 200-day.
Latest sector rankings:
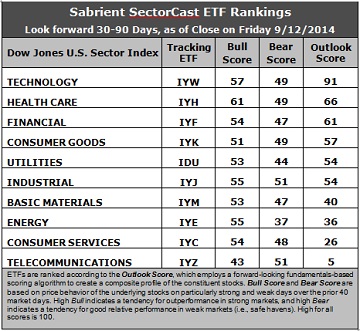
Relative sector rankings are based on our proprietary SectorCast model, which builds a composite profile of each equity ETF based on bottom-up aggregate scoring of the constituent stocks. The Outlook Score employs a forward-looking, fundamentals-based multifactor algorithm considering forward valuation, historical and projected earnings growth, the dynamics of Wall Street analysts’ consensus earnings estimates and recent revisions (up or down), quality and sustainability of reported earnings (forensic accounting), and various return ratios. It helps us predict relative performance over the next 1-3 months.
In addition, SectorCast computes a Bull Score and Bear Score for each ETF based on recent price behavior of the constituent stocks on particularly strong and weak market days. High Bull score indicates that stocks within the ETF recently have tended toward relative outperformance when the market is strong, while a high Bear score indicates that stocks within the ETF have tended to hold up relatively well (i.e., safe havens) when the market is weak.
Outlook score is forward-looking while Bull and Bear are backward-looking. As a group, these three scores can be helpful for positioning a portfolio for a given set of anticipated market conditions. Of course, each ETF holds a unique portfolio of stocks and position weights, so the sectors represented will score differently depending upon which set of ETFs is used. We use the iShares that represent the ten major U.S. business sectors: Financial (IYF), Technology (IYW), Industrial (IYJ), Healthcare (IYH), Consumer Goods (IYK), Consumer Services (IYC), Energy (IYE), Basic Materials (IYM), Telecommunications (IYZ), and Utilities (IDU). Whereas the Select Sector SPDRs only contain stocks from the S&P 500, I prefer the iShares for their larger universe and broader diversity. Fidelity also offers a group of sector ETFs with an even larger number of constituents in each.
Here are some of my observations on this week’s scores:
1. There is only some minor shuffling in the rankings. Technology still holds the top spot with an Outlook score of 91. The sector displays relatively solid scores across most factors in the model, including the best Wall Street analyst sentiment (net upward revisions to earnings estimates), a good forward long-term growth rate, and strong return ratios. The forward P/E is below average (Financial and Energy sport the lowest), but insider sentiment (open market buying) is now among the highest. Healthcare returns to the second spot this week with a score of 66 as the sector displays improving sell-side analyst sentiment (upward revisions) and insider sentiment, as well as strong return ratios and long-term forward growth rate. Financial has risen to the third spot, followed by Consumer Goods/Staples and Utilities rounding out the top five.
2. Telecom stays in the cellar this week with an Outlook score of 5, as the sector has low scores on most factors in the model. Consumer Services/Discretionary stays in the bottom two with a score of 26, despite the strongest forward long-term growth rate. Energy has borne the brunt of Wall Street’s downward earnings revisions.
3. Looking at the Bull scores, Healthcare displays the strongest score of 61, followed by Technology at 57. Telecom is the only sector scoring below 50, with a score of 43. The top-bottom spread is 18 points, reflecting fairly low sector correlations on particularly strong market days. It is generally desirable in a healthy market to see low correlations and a top-bottom spread of at least 20 points, which indicates that investors have clear preferences in the stocks they want to hold, rather than the all-boats-lifted-in-a-rising-tide mentality that dominated 2013.
4. Looking at the Bear scores, Utilities fell precipitously this week on the heels of its extremely weak performance, now scoring only 44, which is 10 points lower than last week and considerably lower than the 60-70 range it had been showing recently. Telecom and (surprisingly) Industrials display the highest Bear scores this week, as stocks within these sectors have been the preferred safe havens on weak market days. Energy continues to display the lowest score, this week falling even further to 37. The top-bottom spread remains at 14 points, reflecting relatively high sector correlations on particularly weak market days. Again, it is generally desirable in a healthy market to see low correlations and a top-bottom spread of at least 20 points.
5. Technology displays the best all-weather combination of Outlook/Bull/Bear scores, while Telecom is clearly the worst. Looking at just the Bull/Bear combination, Healthcare is the clear leader, followed by Technology and Industrial, indicating superior relative performance (on average) in extreme market conditions (whether bullish or bearish). Energy scores the worst, followed by Telecom, indicating general investor avoidance during extreme conditions.
6. Overall, this week’s fundamentals-based Outlook rankings continue to look neutral, as defensive and economically-sensitive sectors are mixed about in the rankings. However, I am seeing a glimmer of bullish hope in that the top two Outlook scores also sport the highest Bull scores, and Industrial and Financial seem to be subtly gaining some strength in the rankings. We’ll see how this plays out over the next couple of months.
These Outlook scores represent the view that the Technology and Healthcare sectors remain relatively undervalued, while Telecom and Consumer Services/Discretionary may be relatively overvalued based on our 1-3 month forward look.
Stock and ETF Ideas:
Our Sector Rotation model, which appropriately weights Outlook, Bull, and Bear scores in accordance with the overall market’s prevailing trend (bullish, neutral, or bearish), suggests holding Healthcare, Technology, and Industrial (in that order) in the prevailing bullish climate. (Note: In this model, we consider the bias to be bullish from a rules-based standpoint because SPY is above both its 50-day simple moving average and its 200-day SMA.)
Other highly-ranked ETFs from the Healthcare, Technology, and Industrial sectors include iShares NASDAQ Biotechnology ETF (IBB), iShares Global Tech ETF (IXN), and SPDR S&P Transportation ETF (XTN).
For an enhanced sector portfolio that enlists top-ranked stocks (instead of ETFs) from within Healthcare, Technology, and Industrial, some long ideas include Regeneron Pharmaceuticals (REGN), Gilead Sciences (GILD), SolarWinds (SWI), Open Text (OTEX), FedEx (FDX), and Kansas City Southern (KSU). All are highly ranked in the Sabrient Ratings Algorithm and also score within the top two quintiles (lowest accounting-related risk) of our Earnings Quality Rank (a.k.a., EQR), a pure accounting-based risk assessment signal based on the forensic accounting expertise of our subsidiary Gradient Analytics. We have found EQR quite valuable for helping to avoid performance-offsetting meltdowns in our model portfolios.
However, if you think the market has come too far and you prefer to maintain a neutral bias, the Sector Rotation model suggests holding Technology, Healthcare, and Financial (in that order). Surprisingly, if you have a bearish outlook on the market, the model suggests holding the same three, but in a different order: Healthcare, Technology, and Industrial (in that order).
Disclosure: Author has no positions in stocks or ETFs mentioned.
Disclaimer: This newsletter is published solely for informational purposes and is not to be construed as advice or a recommendation to specific individuals. Individuals should take into account their personal financial circumstances in acting on any rankings or stock selections provided by Sabrient. Sabrient makes no representations that the techniques used in its rankings or selections will result in or guarantee profits in trading. Trading involves risk, including possible loss of principal and other losses, and past performance is no indication of future results.