

Lots of interesting chart levels today:
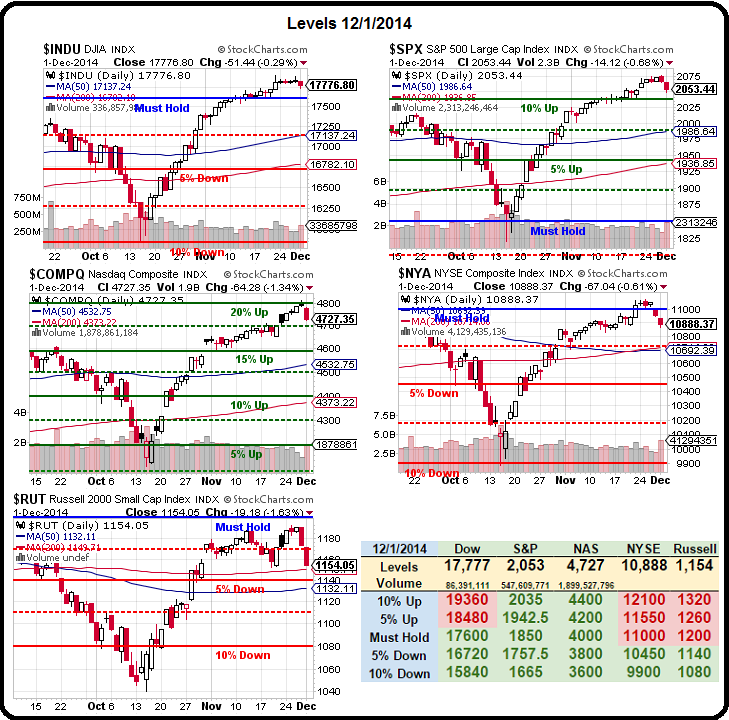
As you can see from our Big Chart, the damage has been done over the past week as the Russell has once again failed at the Must Hold line, as has the NYSE and now we're watching 17,600 very closely on both the Dow and the Nikkei (which we're shorting this morning at 17,800 on /NKD Futures) and the Nasdaq has been rejected at the 20% line (ridiculous anyway) and the S&P will test its 10% line at 2,035.
 While I'm not a big proponent of TA, we still pay attention to it as the majority of traders are using it and that makes it a self-fulfilling prophesy as so many people trade off the same lines that the lines appear to have some meaning.
In truth, those lines are no more a barrier to stock movement than the lines on the highway are to stop you from changing lanes. You might generally stay within the lines but, every once in a while, you simply cross them.
The fact that you USUALLY don't doesn't lead you to conclude that they are a wall, does it? Why then, when looking at a chart, would you conclude that arbitrary lines are a floor or a ceiling to movement? Surely the stock doesn't know where those lines are.
 AAPL sure didn't know where it's line was yesterday as that stock had a mini "flash-crash" and plunged to $111.50 (6.3%) in the first 21 minutes of trading yesterday and then spent the rest of the day recovering half of its losses.
There were stories about weak IPad sales but nothing particular worthy of a panic sell-off and, in fact, BCS upped their target on AAPL to $140 before the market opened – certainly nothing worthy of AAPL losing $40Bn in market cap in less than 30 minutes!
AAPL's drop took the Nasdaq with it, of course, as well as other high-flyers like BABA – as traders simply start dumping first and then try to find out why they are doing it. Fortunately, at PSW, aside from being well hedged, we are well-trained to ignore this kind of nonsense though it would do us all well to remember that, in a thinly traded market like this one, even the World's largest, most liquidly traded company is subject to major panic sell-offs.
 That's why we went to mainly CASH!!! in November and we'll continue to be "Cashy and Cautious" into the Holidays – because we don't want to panic when our favorite stocks drop 6% in 20 minutes – we want to be BUYING… We're not long-term bearish but we do expect a correction of at least 5%, hopefully 10%, between now and the end of January – THEN we'll buy.
Meanwhile, our short-term hedge is DXD (Dec $22 calls at 0.45) and in Jan we have TZA for protection (Members Only) and in March we have a bearish spread on XRT and for June we have a bullish spread on SQQQ, so we have LOTS of protection in our Short-Term Portfolio (now up 72.4% for the year), so we'll be looking for bullish bargains for our Long-Term Portfolio (up 20.9%) as things go on sale into January earnings.
At the moment, it's very hard to find stocks that are on sale. There are, of course, the Commodity and Materials sectors – but they are so out of favor at the moment that all my best table-banging techniquest to BUYBUYBUY while they are cheap are being ignored. We have plenty in our Long-Term Portfolio already but whenever someone says what do you like and I say ABX ($12.41) or CLF ($8.36) or RIG ($20) – they still think I'm nuts.
 As you can see from Doug Short's valuation chart from our Chart School, we have already surpassed the overbought stock conditions of 1929 and are now on approach towards the insane levels of the dot com bubble. Of course, that should be obvious with companies like TSLA, AMZN and NFLX trading at HUNDREDS of times their earnings.
Take AMZN, for example, they made 0.60 per $330 share last year (p/e 550) and HOPE to make 0.86 next year (p/e 383). In order for them to get down to a still-ridiculous p/e of 50, they have to increase earnings by 10 times the current level.
Since they project 33% revenue growth to get from 0.60 to 0.86 (43%), let's say that revenues need to climb just 7 times to grow them to a p/e of $50 (if the stock stays at the same price). That would require another $700 BILLION in sales. Where the Hell is that going to come from?
 At some point, you have to look outside of the company and think about the planet. Will AMZN sell twice as much stuff as WMT ($476Bn last year)? If so, who are they going to take it from? Doesn't BABA have the same plan – as well as a dozen other on-line retailers? At what point do they suck up all the money on Planet Earth?
So, if the company can NEVER get to a p/e of 50 (without hyper-inflation) at $330, why would be buy them for $330 – ultimately, it's going to be a losing bet as growth disappoints.
Unfortunately, the last time I had to write LOGICAL articles like this was back in 2007, when we were topping out before the last crash, but I also told people the same thing in 1998 and I was "wrong" for a whole year before I was right. As you can see on Doug's chart – things CAN get crazier, especially when the US looks "safe" compared to other countries – I just don't want to bet on crazy as my investing premise.
Be careful out there.