
That was not a bad week!
I ended up bullish last weekend and, other than a quick cover on Wednesday, we had little reason to change our stance for the week. Of course changing my stance and selling the TSO puts on Monday accounted for 3/4 of the week's spectacular gains but that is the whole purpose behind the portioning strategy we use and I have decided to try to rewrite a more in-depth section, with more examples for the member section.
Sage put in a couple of hedged trades for the $10K Virtual Portfolio in our educational post and the up and down consolidating movement of the market made it a perfect week for them. DNDN pulled back off it's highs (as predicted) and there were many opportunities to work in but we stuck with the position we already had. OXPS was entered as an naked leap with the Jan '08 $30s opening at $1.30 and finishing the week up 17%. NYX went down a little more than we wanted, opening at $97 and dropping to $93.50 by Friday as we sold the May $100s for $3.75 (now $2.50) against our June $100s at $5.50 (now $4).
These plays take patience but we need that now as our impatient attempt to make money on the oil plays went badly as did our MRK cover play. This leaves the $10K Virtual Portfolio with just $2,945 in cash and $6,813 in positions, dropping us down to $9,758 and we will have to get lucky to get out of this week with our $10,000 intact.
Monday was a so-so day but our dollar was heading down the drain and oil and gold took a very unfortunate lead for the week. I have said in the past many times that stocks are a commodity too and, at first, they will rise with the rest but, ultimately, we end up facing a trade-off between runaway inflation and lower corporate profits that can get ugly fast. Monday was the day we threw in the towel and went long (sort of) on TSO by selling the $110 puts. Unfortunately, this option is not available to most $10KP players but it worked out great in the STP.
Also Monday's general instruction to members bears repeating as this goes for any time we are within 2 weeks of expiration: "I hope it goes without saying that ALL April Contracts need to follow the 20% rule (get out if you lose 20% of your profits) as you are now losing 10% of your premium per day." Needless to say we ended up cutting back quite a few positions this week.
AA kicked off earnings season on Tuesday but got yawns for a great report as did most of our earners for the week. INFY did well but that's not really good news for US and surprisingly MTG did well too. GE got a bit of respect as did RAD but both are safety stocks so nothing to write home about there. The BOJ and the ECB held rates steady and China pledged to curb growth so I'd hate to see what would have happened to our currency if the rest of the World DIDN'T try to rescue it. We got a good sign from an NYSE breakout and we switched to a more aggressive chart reflecting our more positive outlook:
|
|
|
Day’s |
Break |
50 |
62% |
Break |
|
Index |
Current |
Move |
Down |
DMA |
Fib Level |
Up |
| Dow | 12,569 | 9 | 12,450 | 12,450 | 12,528 | 12,650 |
| Transports | 2,799 | 15 | 2,736 | 2,817 | 2,889 | 2,983 |
| S&P | 1,444 | 1 | 1,410 | 1,426 | 1,427 | 1,460 |
| NYSE | 9,429 | 2 | 9,250 | 9,250 | 9,218 | 9,465 |
| Nasdaq | 2,469 | -2 | 2,400 | 2,440 | 2,454 | 2,500 |
| SOX | 472 | -3 | 470 | 472 | 477 | 490 |
| Russell | 811 | -2 | 790 | 798 | 803 | 820 |
| Hang Seng | 20,347 | 138 | 19,400 | 19,941 | 20,192 | 20,600 |
| Nikkei | 17,664 | -79 | 17,200 | 17,417 | 17,617 | 18,000 |
| BSE (India) | 13,189 | 12 | 12,750 | 13,425 | 13,814 | 14,200 |
| DAX | 7,148 | 48 | 6,700 | 6,818 | 6,830 | 7,100 |
| CAC 40 | 5,754 | 13 | 5,500 | 5,597 | 5,601 | 5,780 |
| FTSE | 6,422 | 25 | 6,200 | 6,298 | 6,297 | 6,450 |
At Tuesday's close I shifted my concerns to the IEF chart, another sign of the dollar and we started tracking the DBE to give us another broad indicator on the energy market (and boy, was it depressing this week!). Our friends at the WSJ decided we didn't have enough terror in our lives and they started the Real-Time Global Disaster Map for our cowering pleasure.
 Wednesday we were uncertain but hopeful and the market dashed those hopes early as reports gave some pretty strong signs of stagflation rearing its ugly head. The metaphysical question of the day is – if we leave the market alone is it alive or dead or does our simple observation of it make it impossible for us to get a clear reading of market sentiment?
We got our Fed minutes at 2, but the market was already on its way down and, in a mirror reflection of the Fed statement, the market dropped off before anyone could possibly have had time to read them. Nonetheless I closed Wednesday saying: "Half our 62% levels are holding so we’ll keep this in the plus column at the moment and don’t forget we pumped these levels up on Monday because we blew through the old ones last week. So don’t worry, we’ve only pulled back 90 points after an 8-day, 300 point run, until we drop below 12,450 on the Dow it’s not even too much of a pullback."
Thursday we got a nice push down that gave us a quick profit on our mattress plays followed by a recovery that made us very glad we didn't sell our calls – all in all, a really good day. Friday morning we were prepared for a drop but got a pretty good gain and, while we wondered how long the markets will continue to ignore the economic data. I was very worried about the sharp drop in capital spending, especially as we are somehow burning record amounts of crude while the economy is slowing. The markets started off with a bit of a dip but the Dow came back, let by MRK (damn) and posted a 59-point gain to finish the week just on the plus side.
From a cash basis we had a fabulous week but, as I said, only because we got backed into a corner by TSO and we covered our puts with a large upside bet. Because the TSO trade was an initial credit of $400 per contract and because we took them back out at $115 (not wanting to risk into the weekend) we ended up with a 265% overall gain on cash (as it was a big position), but the average gain on 27 closed positions was a more normal 41% on 22 average days held. There's no pride in being lucky but there's nothing wrong with it once in a while either!
Our open short-term positions are in pretty much the same dreary shape they were in last week with 80 open positions, all about break even but very bullish and a pretty old 36 average days open. If the market doesn't make a bullish move soon we will need to really shift into the business of selling shorter positions as we've already got enough invested in existing positions.
After taking off most of our covers our Long-Term Virtual Portfolio had pretty much the same sort of week as the rest of the markets. 44 open positions have now been open for an average of 77 days with a 59% cash gain and a 172% average open gain. We were in and out of some covers this week but they amounted to little and I'll be doing a full review of the LTP this weekend, as we need to make some very real decisions there this week. I'm not too worried though because Jan 20th we wrapped up our first week of earnings season with 75 open positions that had dropped to 1/2 of the previous week. The difference is that there we were coming off some spectacular gains, and our last couple of weeks have been pretty slow.
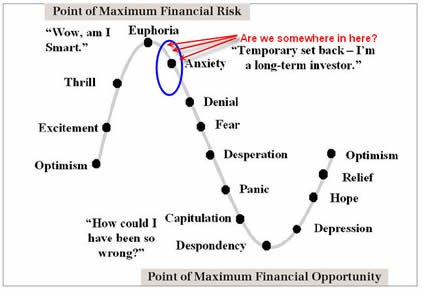
We were worried about being on the downside of the Anxiety/Euphoria curve that week and we did flatline but the world didn't actually end until 2/22, giving us plenty of time to sell covers!
I will restate what I said on Jan 27th: "Options plays require some volatility and going up 100, down 100, up 50 down 50 is not the kind of volatility we want!" Interestingly, that was the week we were reaching the end of our rope shorting LVS as it climbed past $105, close to $110 before finally giving up and giving us one of our biggest wins of the year. I've called TSO our now LVS and we'll still have to see if that prediction pans out as TSO rocks and rolls over $110.
Our 14 regular stock positions are up an average of 24%, not bad for pokey little stocks with 64 average open days. TSN really exploded and is our oldest holding and KNOT is coming on strong with OXPS making a quick comeback.
Closed positions for the week were as follows:
|
Symbol |
|
|
|
|
Qty |
Paid |
Sold |
|
P/L |
% |
| AAPL | M | $ 100 | P | 3/28 | -4 | $7.80 | $ 8.25 | 4/11 | $ 0.45 | 6% |
| AMAT | M | $ 19 | C | 4/4 | 30 | $0.45 | $ 0.80 | 4/11 | $ 0.35 | 78% |
| BA | A | $ 90 | C | 3/29 | -40 | $1.70 | $ 1.15 | 4/11 | $ (0.55) | 32% |
| BTU | A | $ 45 | P | 4/6 | 10 | $1.80 | $ 1.30 | 4/9 | $ (0.50) | -28% |
| COP | A | $ 70 | P | 4/4 | 20 | $ 2.70 | $ 2.00 | 4/9 | $ (0.70) | -26% |
| COP | A | $ 70 | C | 3/29 | 100 | $ 0.55 | $ 0.95 | 4/13 | $ 0.40 | 73% |
| DD | A | $ 50 | C | 4/6 | 30 | $0.35 | $ 0.65 | 4/9 | $ 0.30 | 86% |
| DIA | M | $ 125 | P | 4/9 | 200 | $1.48 | $ 1.80 | 4/12 | $ 0.32 | 22% |
| DIA | M | $ 124 | P | 4/11 | 100 | $1.30 | $ 1.30 | 4/12 | $ – | 0% |
| FDX | M | $ 115 | C | 3/26 | 80 | $1.00 | $ 1.10 | 4/9 | $ 0.10 | 10% |
| HES | M | $ 55 | P | 4/3 | 20 | $1.65 | $ 1.20 | 4/11 | $ (0.45) | -27% |
| HOTT | A | $ 10 | C | 3/7 | 10 | $1.40 | $ 1.25 | 4/9 | $ (0.15) | -11% |
| ICE | A | $ 135 | C | 4/6 | 3 | $1.85 | $ 1.50 | 4/10 | $ (0.35) | -19% |
| ICE | A | $ 125 | P | 4/6 | 3 | $2.20 | $ 2.20 | 4/10 | $ – | 0% |
| INTC | M | $ 20 | C | 1/22 | 80 | $0.65 | $ 0.75 | 4/9 | $ 0.10 | 15% |
| INTC | J | $ 20 | C | 3/5 | 50 | $0.98 | $ 1.45 | 4/11 | $ 0.47 | 48% |
| IWM | M | $ 77 | P | 3/13 | 100 | $1.55 | $ 0.85 | 4/11 | $ (0.70) | -45% |
| LLY | A | $ 55 | C | 11/8 | 40 | $0.35 | $ 2.00 | 4/13 | $ 1.65 | 471% |
| OIH | A | $ 145 | P | 4/2 | 10 | $2.00 | $ 0.85 | 4/10 | $ (1.15) | -58% |
| RIG | A | $ 80 | P | 4/4 | 20 | $0.70 | $ 0.70 | 4/11 | $ – | 0% |
| RIMM | A | $ 130 | P | 3/30 | 80 | $0.85 | $ 1.55 | 4/12 | $ 0.70 | 82% |
| T | A | $ 40 | C | 4/4 | 40 | $0.25 | $ 0.30 | 4/9 | $ 0.05 | 20% |
| TSO | A | $ 100 | P | 4/3 | 20 | $1.40 | $ 0.60 | 4/9 | $ (0.80) | -57% |
| TSO | A | $ 110 | P | 4/9 | -200 | $4.00 | $ 1.15 | 4/13 | $ (2.85) | 71% |
| TXN | A | $ 30 | C | 4/3 | 20 | $0.75 | $ 1.25 | 4/11 | $ 0.50 | 67% |
| UNP | A | $ 105 | C | 4/4 | 5 | $1.70 | $ 5.75 | 4/9 | $ 4.05 | 238% |
| VLO | A | $ 68 | C | 4/11 | 20 | $1.00 | $ 1.60 | 4/13 | $ 0.60 | 60% |
| VLO | J | $ 70 | C | 4/11 | 15 | $2.11 | $ 2.75 | 4/13 | $ 0.64 | 30% |
So far so good with the market's reaction to earnings but nothing to get excited about just yet. We'll be taking some good momentum plays as soon as we get some multiple earnings confirmations by sectors. We haven't had any really bad earnings and RIMM got slapped down pretty hard for a small disappointment so we're not out of the woods yet but these gains may let us begin to see a little bit of light.
|
|
|
Week's |
Break |
50 |
62% |
Break |
|
Index |
Current |
Move |
Down |
DMA |
Fib Level |
Up |
| Dow | 12,612 | 68 | 12,400 | 1,245 | 12,528 | 12,650 |
| Transports | 2,829 | 29 | 2,736 | 2,817 | 2,889 | 2,983 |
| S&P | 1,452 | 9 | 1,410 | 1,426 | 1,427 | 1,460 |
| NYSE | 9,522 | 96 | 9,250 | 9,250 | 9,218 | 9,465 |
| Nasdaq | 2,491 | 20 | 2,400 | 2,440 | 2,454 | 2,500 |
| SOX | 475 | 5 | 470 | 472 | 477 | 490 |
| Russell | 819 | 6 | 790 | 798 | 803 | 820 |
| Hang Seng | 20,340 | 131 | 19,400 | 19,941 | 20,192 | 20,600 |
| Nikkei | 17,363 | -120 | 17,200 | 17,417 | 17,617 | 18,000 |
| BSE (India) | 13,384 | 528 | 12,750 | 13,425 | 13,814 | 14,200 |
| DAX | 7,212 | 112 | 6,700 | 6,818 | 6,830 | 7,100 |
| CAC 40 | 5,789 | 48 | 5,500 | 5,597 | 5,601 | 5,780 |
| FTSE | 6,462 | 65 | 6,200 | 6,298 | 6,297 | 6,450 |
Looks like it's up to Europe to lead the way so if Asia can pull out of the basement and Europe can stay green, we may have another fun week of ignoring the economy and taking the markets up even higher.
Have a great weekend,
– Phil