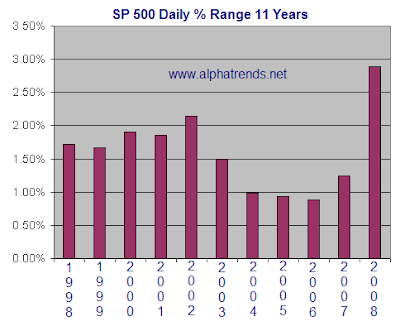
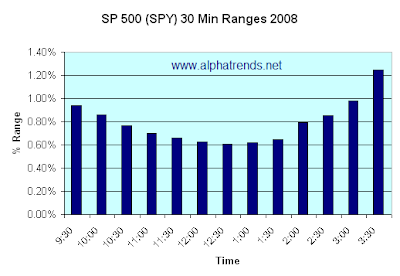
Brian Shannon, at AlphaTrends, provides a graphic view of the S&P 500’s volatility in 2008. In the first chart, you can see average volatility surging at the end of the day. As a whole, volatility more than doubled from that during the previous 4 years and was substantially higher than in the previous 10 year period.
S&P 500 Volatility 2008
The chart below represents the difference between the high and low of each 30 minute period (9:30-10:00, 10:00-10:30, etc.) divided by the opening price of that time period. The average range of each 30 minute period over the entire year was 0.79% As you might expect, the final thirty minutes of trading was the most volatile with a range of 1.25%
The average daily range of the SPY in 2008 was 2.89%, well ahead of the 11 year average of 1.77%