
Continuing our theme for 2009 predictions, here are Allan’s charts and thoughts on the market for early 2009 –don’t worry, not 2009 predictions, just two areas of focus: the DJIA (reflecting the stock market in general), and Gold.
Two thousand and nine predictions
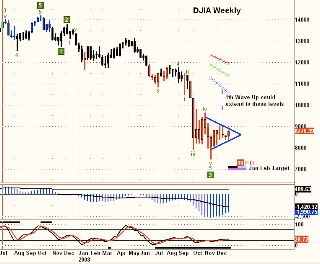
The last six weeks of 2008 saw the DJIA creep sideways in what appears to be a wedge formation, suggesting that in the first week or two of January the market will either break up out of the wedge and carry all the way to 10,000, or conversely break down out of the wedge with an initial target of 7,000. Despite the apparently conflicting nature of this analysis, it does provide a road map for the next couple of months, based upon the market’s behavior over the next two or three weeks.
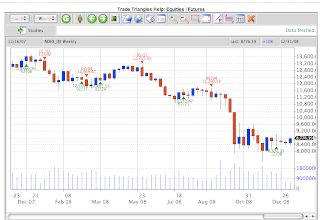
Staying focused on the DJIA, the Triangles on the weekly chart are barely clinging to a Buy signal from three weeks ago. A hard break of the 8,400 level will likely trigger a Sell signal. Thus on both the EW chart and the Triangle chart, any significant weakness directly ahead will likely generate a tradable decline to new 52 week lows.

Note how on the above chart the same wedge appears while the MACD seems to be making a bullish crossover, suggesting a move upward toward the declining moving averages, again at about 10,000-11,000 basis the DJIA. Any decline now, one that nullifies the bullish crossover, would trigger a very bearish "hook" on the weekly MACD.
Enough with the ambiguity? Sometimes that’s all the market offers and now is one of those times. But it can’t hold its cards indefinetly, the next significant move is one that can be followed with some confidence, whether up or down.

Above is a chart of the XAU Gold Mining Index. This chart bears watching very closely as superimposed upon it is an aggressive EW count suggesting that gold stocks are in the very beginning of a new bull market. The XAU could easily double in price if this wave count is correct and then it would only be the first wave up before a consolidation leads to even more significant gains.

Supporting the bullish XAU chart is the Triangle chart on Gold, showing a late November BUY signal followed by a robust rally.

Finally, this weekly chart of XAU shows the recent strength was enough to break out above a 10 month down channel, a fresh MACD Buy cross-over and no real price resistance until over 200 on the index, a near double from current levels.
The market is going to be volatile no matter what direction it goes, but a major bear market has asserted itself and until proven otherwise, that’s the course of future prices. Gold and Gold Stocks may be my next best idea if the rally from the late October lows extends on the heels of geopolitical and domestic economic cycles that are running on the scary side of miserable in the current global environment.
Update (Jan. 7)

No change in chart analysis as new weekly bar has not clearly broken out of wedge pattern. The longer it takes to break upward, the less likely it will. Any breakdown from here will suggest a wicked decline, taking all the new bulls out for the count.