I was hoping not to have to put the weekly theme song that ran for 3 or 4 months back on the Favorites’ backup site.
Down, down, down
Courtesy of Allan

Here is an updated Weekly S&P chart, including Wednesday’s dive as well as the extension lower, not helped by the sad and market-moving news about Steve Jobs after hours. I’ve added a potential support level that was automatically generated by my software, based on typical lengths of waves under the Elliott Wave Principle. Yes, that says 700 on the S&P 500.
Now for the bad news:
Above is the Daily S&P chart with an added first support projection indicated to be about 650. Worse yet, the minimum projection for the end of this five-wave decline is indicated to be just below the 600 level.
One more, if you can stand it:

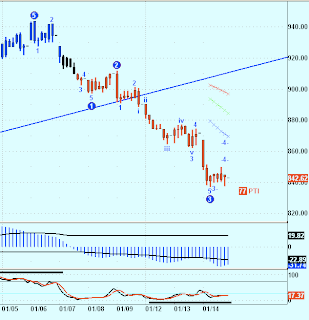
This is the Sixty minute chart, showing the shorter-term waves division. Consistent with the Daily and Weekly charts, this shorter term snapshot shows how the larger waves in the above charts are breaking down in a fractal of the major count and how since breaking the bottom of the Wave 4 channel shown in the other charts, prices have been accelerating down.


