
Corey Rosenbloom at Afraid to Trade reviews the XLF Financials, including an Elliott Wave analysis.
A Weekly Look at the XLF Financials with Elliott Wave
Courtesy of Corey Rosenbloom at Afraid to Trade
With a very volatile week behind us, let’s step back and take a look at the XLF Financial Sector from its 2007 peak to present.
XLF Financial SPDR:

The XLF actually topped in May 2007, five months ahead of the October 2007 stock market top which underscores the assumption that Financials lead the broader market. If they continue to lead, then we’re not in a positive scenario for equities.
Price broke the November lows last week to carve in a fresh low at $8.00 per share (a level 77% off its highs), which by no means is bullish. The one slight optimistic picture is that we painted a hammer or dragonfly doji candle at these lows, though that by no means is a good enough reason to buy.
We see price as beneath all three key moving averages on the weekly chart, and they are in the most bearish orientation possible, though we are extended roughly $6 beneath the falling 20 week EMA which one would think would signify ‘oversold’ conditions but look at the 3/10 Oscillator – it is indicating that we’re not quite oversold and that we would have a bit more to travel down before we registered a new low. Anything else would result in a positive divergence, which might actually be what happens.
Notice that the oscillator made a new momentum low in November, signaling lower prices were yet to come – they came this week.
A few readers have asked me to do an Elliott Wave count on the XLF and here is one interpretation – albeit a bearish one – on the XLF. You’ll need to click on the chart for a larger image.
XLF Possible Elliott Wave Count:
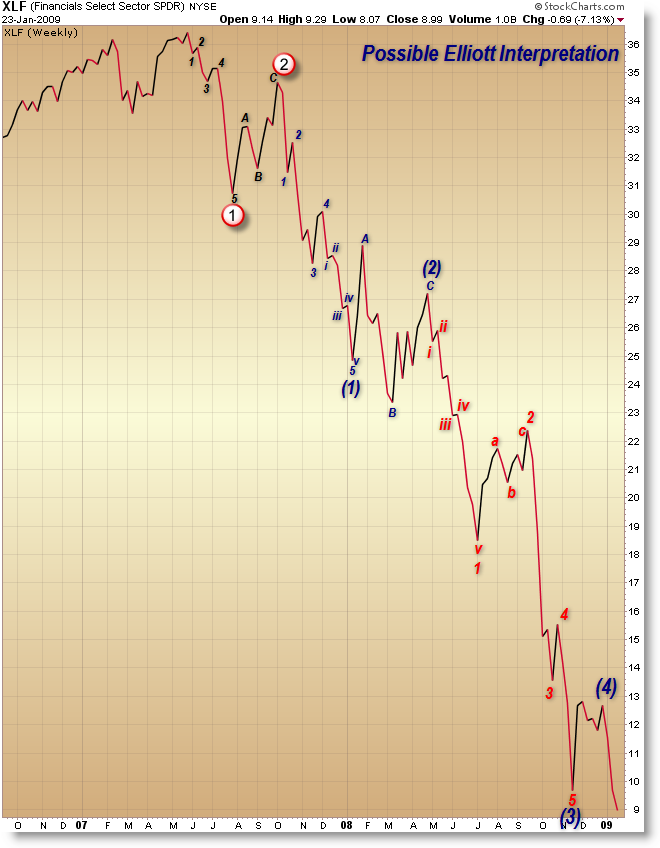
What I’m showing is the more bearish of the two possibilities, similar to that on the S&P 500. I’m showing us as having completed a fourth wave up within a larger (circled) Wave 3 down and that we are currently in fractal 5th of larger scale Third Wave down which is likely about to complete. The only two labels missing from this count at the end (right) would be the (5) and then circled 3 when this downswing is complete.
The good news with this count is that when this downswing completes, we would have put in the end of the hideous 3rd Wave down and would be entering a Fourth Wave (circled) up, which could take us anywhere from $13.00 to $16.00 before resolving back down to new potential lows mid-2009.
I call this the most bearish count because it implies that a final low will take place much lower, as the final 5th wave would terminate at a lower price that the alternate count.
The good news for BOTH scenarios is that we should expect Wave 5 to have equality with Wave 1, which was about $5.00 ($36.00 – $31.00). Because Wave 3 was a (massively) extended wave, expect Wave 5 to equal that of Wave 1 (or perhaps – most bullishly – truncate at the bottom of the major Wave 3 (circled).
The alternate – which I deem “bullish” – count is the following:
Where I have (3) at the November lows, it would actually be Circled 3 (major 3) meaning that the 3rd wave terminated at the November lows and that we now have completed a Circled (major) 4 corrective wave and that – if that’s the case – then we’re already in Circled (major) 5, meaning the ‘bottom’ would be closer (perhaps just a few more swings away) and would terminate at a higher price than the count I’ve shown.
 The good news for BOTH scenarios is that we should expect Wave 5 to have equality with Wave 1, which was about $5.00 ($36.00 – $31.00). Because Wave 3 was a (massively) extended wave, expect Wave 5 to equal that of Wave 1 (or perhaps – most bullishly – truncate at the bottom of the major Wave 3 (circled).
If it seems confusing, don’t worry – Elliott Wave is not the holy grail, but it’s like any other indicator which is open to interpretation. Use it to manage risk and open your mind to possibilities and give you structure, but don’t follow it blindly.
Keep watching the XLF and key financial stocks closely, as we would expect to see strength here (which we’re not) before believing the market could recover or – dare I say – bottom.
Join the Market Club for additioal analysis, commentary, trading signals, and education.
Corey Rosenbloom
Afraid to Trade.com
Monty Python and the Holy Grail – Three Questions