
Looking ahead, some signs that the brutal beginning to 2009 is approaching a conclusion.
March 7 Weekend Look at the SP 500 Index
Courtesy of Corey Rosenbloom at Afraid to Trade
What a week we just endured in the markets. Let’s take a step back now that the weekend is upon us to look at the Weekly and Daily Structure of the S&P 500:
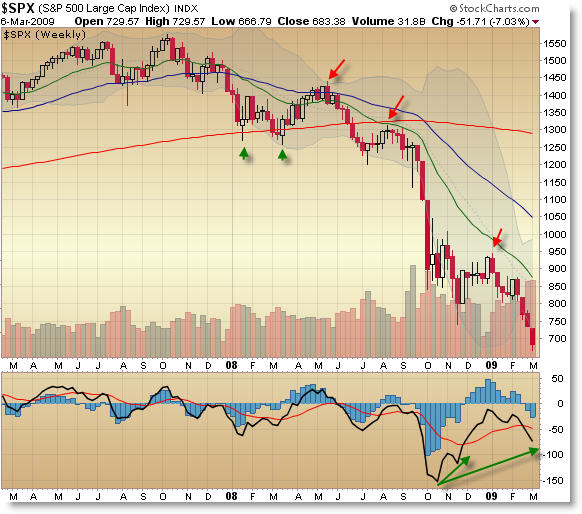
It’s been an absolutely brutal and devastating past four weeks for investors – I cannot underscore this point enough. The S&P has fallen 22% in the last four weeks which classifies for its own definition of a “Bear Market.” There’s some good news though.
Within the (Elliott) Wave Structure, it appears that price is coming to the end of the final 5th Wave and that a rally may be expected to take place from here. Also, we see a positive momentum divergence forming as price hits new lows not seen since 1996. Fifth Waves often form on positive momentum divergences, so we are seeing this behavior conform to expectations. Volume is also at relatively high levels into these price lows.
For a full image of the proposed Elliott Wave Count on the S&P 500, see this chart (link) or the blog post entitled Similarities in 1937 and Today.
Let’s drop down to the Daily Chart to see if we can get any insights there.
S&P 500 Daily:

Well, let’s start with the positive. Price reached a new low beneath 700 on a Triple-Swing Positive Momentum Divergence (new low in October; new low in November; new low in March) which could arguably be classified as a “Three Push” pattern which is a type of reversal pattern.
Price also rallied sharply into Friday’s close which formed a Doji which is often seen as a short-term reversal pattern (technically, a doji represents “indecision” between buyers and sellers). Also, we are at the bottom of the Bollinger Band… but have been so since mid-February. In strong moves, price has a tendency to “Ride the Bollingers” up or down.
Volume is higher than average and certainly volume has been increasing as the year progressed… though that’s not necessarily a good sign, as we would see this as a ‘confirmation’ of lower prices through higher (trending) volume. There does not seem to be a “blow-off” or capitulation volume spike that is frequently seen at bottoms (reference October 13 and November 23, 2008).
 In the short-term Elliott Wave structure, we appear to be ending – perhaps – wave (3) of (circled) 5 which – if the interpretation is correct – hints that we have a wave (4) to the upside (which could begin as early as Monday next week) which could take us to EMA resistance near 750 before a final wave (5) takes us back to new lows (or a test of the lows) wherein we might get the volume surge/capitulation and surge in the $VIX and Put-Call ratio that appear to be lacking as we form these new lows.
In other words, from a sentiment standpoint, it seems like this is not yet the actual bottom (there’s no panic as indicated by classical sentiment measures). We’d prefer to see a surge in the VIX, put-call ratio, and volume to feel like a bottom was put in place.
Let’s keep watching the structure develop, but it seems odds favor a retracement swing up beginning next week… but if we can’t even get that retracement… panic surely would set in.